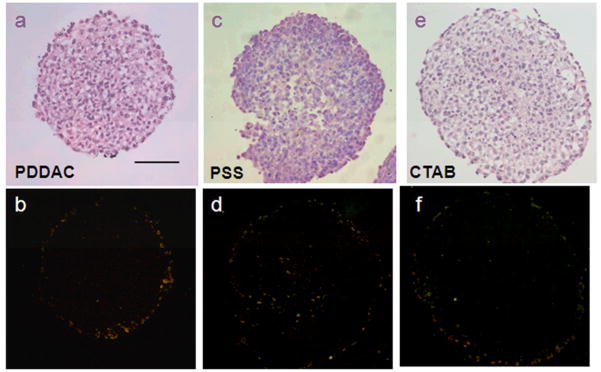
Fig. 4.
Distribution of Au NRs in MCTSs. HE staining of the tumor spheroid treated with different Au NRs for 24 h (a, c. e). DF images of tumor spheroid treated with different Au NRs for 24 h (b. d. f). The bright spots in the DF images represent for the existence of Au NRs. In b and f, Au NRs are distributed mainly outside. In d, Au NRs are distributed both outside and inside (Scale bar, 100 μm).

