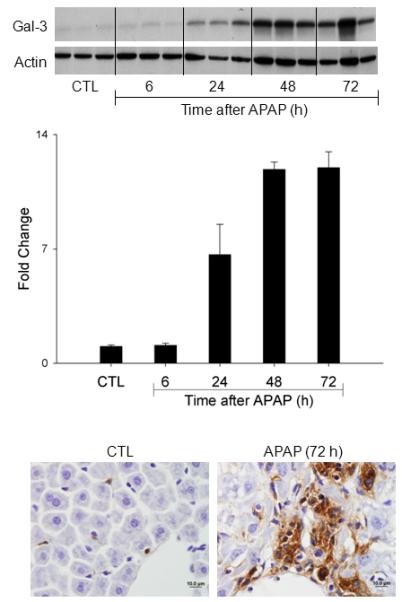
Fig. 4. Effects of APAP intoxication on Gal-3 expression in the liver.

Livers were collected 6-72 h after treatment of wild type mice with APAP or PBS control (CTL). Upper panel. Gal-3 expression was analyzed by western blotting. Actin was used as the loading control. Each lane represents a different animal. Middle panel. Densitometric analysis was performed using ImageJ. Each bar represents the mean ± SE (n = 3 mice). Lower panel. Livers were collected 72 h after treatment of wild type mice with APAP or control. Gal-3 expression was analyzed by immunohistochemistry. One representative section from 6 mice is shown. Original magnification, 100x.
