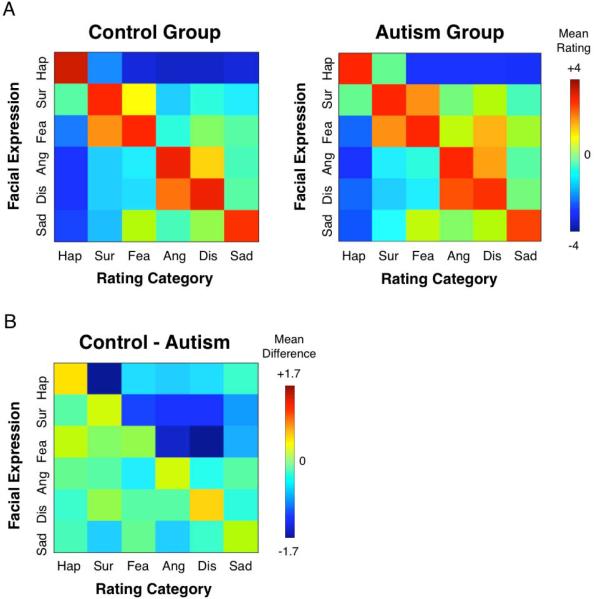
Figure 2.
A. Autism and control group rating matrices. The intended facial expression is given on the y-axis, and the emotion rating category is given on the x-axis. Concordant ratings fall along the diagonal, and discordant ratings fall along the off-diagonal. B. The difference between autism and control groups. No individual cell survives FDR correction for multiple comparisons (q < 0.05).

