Abstract
White matter hyperintensities (WMHs) are often identified on T2-weighted magnetic resonance (MR) images in the elderly. The WMHs are generally associated with small vessel ischemic or pre-ischemic changes. However, the association of WMHs with blood oxygen level dependent (BOLD) functional magnetic resonance imaging (fMRI) signal is understudied. In this study, we evaluate how the BOLD signal change is related to the presence of WMHs in the elderly. Data were acquired as part of a study of late-life depression and included elderly individuals with and without major depression. The subjects were pooled because the presence of depression was not significantly associated with task-related BOLD changes, task performance, and WMH distribution. A whole brain voxel-wise regression analysis revealed a significant negative correlation between WMH burden and BOLD signal change during finger-tapping in the parietal white matter. Our observation that WMHs are associated with a significant diminution of the BOLD signal change underscores the importance of considering cerebrovascular burden when interpreting fMRI studies in the elderly. The mechanism underlying the association of WMH and BOLD signal change remains unclear: the association may be mediated by changes in neural activation, changes in coupling between neuronal activity and hemodynamics, or, perhaps, secondary to the effect of the ischemic changes on the sensitivity of the T2* BOLD MR signal.
Keywords: Functional imaging, structural imaging, white matter hyperintensities, BOLD, aging
1. Introduction
In the elderly, magnetic resonance imaging (MRI)—particularly T2-weighted images—often reveal white matter hyperintensities (WMHs), which indicate the presence of ischemic or pre-ischemic white matter lesions. The lesions are generally associated with myelin pallor, tissue rarefraction, and mild gliosis (Gunning-Dixon et al., 2009; Madden et al., 2009; Debette and Markus, 2010). Neuroimaging studies have shown that WMH burden is associated with cognitive changes of aging, as well as neuropsychiatric disability in the elderly (Wen and Sachdev, 2004). Past studies have indicated an association between greater WMH burden and poorer global cognitive performance, executive function, and processing speed, as well as an increased risk of stroke, dementia, and death (de Groot et al., 2000; Gunning-Dixon et al., 2009; Debette and Markus, 2010). Similarly, diffusion tensor imaging (DTI) studies have shown a direct correlation between white matter integrity and cognitive performance, executive function, and information processing speed (Gunning-Dixon et al., 2009; Madden et al., 2009, Vernooij et al., 2009). A DTI study by Taylor et al. (2001) also showed that WMHs are associated with damage to tissue structure, thus suggesting disruption of white matter tracts. These studies suggest that the white matter lesions underlying the WMHs affect neuronal activity.
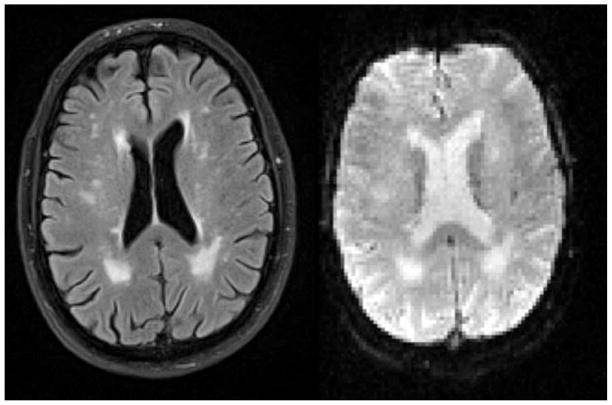
Other studies have shown how cerebrovascular disease influences the coupling between neural activity and corresponding hemodynamics (i.e. cerebral blood flow, cerebral blood volume, and cerebral metabolic rate of oxygen consumption) (Carusone et al., 2002; Rossini et al., 2004). Thus, considering WMHs as a marker for cerebrovascular disease, one would predict that WMHs might contribute to altered hemodynamic coupling, and the neural activity interpreted by blood oxygen level dependent (BOLD) functional magnetic resonance imaging (fMRI) might also be affected in the presence of WMHs. Additionally, the white matter lesions associated with the WMHs affect the T2* BOLD signal itself. On the T2* functional images, the areas with WMHs have increased intensity, similar to T2-weighted fluid attenuated inversion recovery (FLAIR) images (see Figure 1). The presence of WMHs on the T2*-weighted images may alter the sensitivity of the regional T2* BOLD signal.
Figure 1.
Presence of WMHs on T2-weighted FLAIR (left) and T2*-weighted images (right) of the same subject.
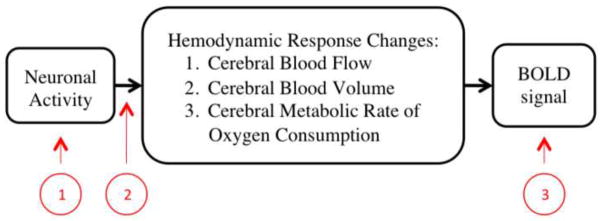
As a summary, Figure 2 demonstrates the three stages where WMHs may influence the study of brain function (neuronal activity) using fMRI BOLD signals. Some past studies have studied the association between WMHs and functional activity based on specific tasks using BOLD fMRI (e.g. Nordahl et al., 2006; Aizenstein et al., 2011; Hedden et al., 2011; Linortner et al., 2012), however the relationship between WMHs and the BOLD fMRI signal is underexplored. Thus, this study evaluates how WMH burden in the elderly is associated with the BOLD signal change determined using a sensory-motor task, which is known to not be significantly associated with WMH burden in task related regions (Linortner et al., 2012). The simple finger-tapping fMRI task was chosen for this study because of its known reliability and reproducibility. Also, we used total WMH burden to represent WMH burden for each subject to reduce the number of independent variables and based on evidence indicating global WMH burden is associated with local WMH burden (DeCarli et al., 2005).
Figure 2.
Flow chart of the physiology behind the BOLD fMRI signal in black. Three ways in which WMHs can affect the BOLD signal in red: 1) by affecting neuronal activity; 2) by affecting the coupling between neural activity and corresponding hemodynamics; and 3) by altering the sensitivity of the regional T2* BOLD signal.
2. Methods
2.1 Subject Recruitment
Elderly non-psychotic, unipolar major depressive disorder (MDD) patients and non-depressed individuals were recruited from the community for a late-life depression study and the same data was used for this structural and functional MRI study. All participants were required to undergo a SCID-IV evaluation. The exclusion criteria included: history of Axis I disorders (except MDD and anxiety disorders for the depressed patients only), stroke, significant head injury, Alzheimer’s, Parkinson’s, and/or Huntington’s disease. Individuals were also excluded if they had taken psychotropic medications within 2 weeks prior the scans. Ten subjects (2 non-depressed and 8 depressed) were excluded from this analysis due to motion artifacts or poor image registration results (evaluated visually using Statistical Parametric Mapping software (SPM5)(Friston et al., 1995) running on MATLAB (Math Works, Natick, Massachusetts, USA)) during the normalization step. Forty-one non-depressed and 33 depressed elderly individuals were included in this analysis. Demographics of the included subjects are shown in Table 1.
Table 1.
Demographics of the included depressed and non-depressed subjects
| Depressed | Non-Depressed | |
|---|---|---|
| Age in years, mean (SD) | 68.3 (6.6) | 71.7 (7.9) |
| Sample Size | 33 | 41 |
| Gender | 13 Males & 20 Females | 12 Males & 29 Females |
| Mini Mental Score(a), mean (SD) | 27.2 (4.0) | 29.9 (1.7) |
| Hamilton D(b), mean (SD) | 20.0 (5.1) | _____(c) |
| Normalized WMH Volume, mean (SD) | 0.00197 (0.0034) | 0.00379 (0.0067) |
Missing data from 4 depressed & 1 non-depressed subjects is not included in average & standard deviation calculations
Missing data from 1 depressed subject is not included in average & standard deviation calculations
Depression screening through psychiatric interviews was performed, but Hamliton Depression Rating Scale was not performed on these subjects
2.2 Image Acquisitions and Data Collection
Subjects were scanned on a 3T Siemens TIM TRIO scanner. T1-weighted images were acquired with a 1 mm slice thickness, 256×224mm resolution, 256×224mm field of view (FOV), 2300ms repetition time (TR), 900ms inversion time (TI), 3.43ms echo time (TE), and 9 degrees flip angle (FA) in the axial plane. T2-weighted images were acquired with a 3 mm slice thickness, 256×224mm resolution, 256×224mm FOV, 3000ms TR, 100ms TI, 101ms TE, and 150 degrees FA in the axial plane. T2-weighted Fluid Attenuated Inversion Recovery (FLAIR) images were acquired with a 3 mm slice thickness, 256×240mm resolution, 256×212mm FOV, 9160ms TR, 2500ms TI, 88ms TE, and 150 degrees FA in the axial plane. Functional images were acquired using a gradient-echo echo planar imaging sequence with a 3 mm slice thickness, 128×128mm resolution, 256×256mm FOV, 2000ms TR, 34ms TE, integrated parallel acquisition technique (IPAT) = 2, and 90 degrees FA in the axial plane. The paradigm performed by the subjects during the functional image acquisition was a 5-minute block-design. There were five 30 seconds long experimental blocks (during which the tapping cue was presented 40 times), and it was alternated with five 30 seconds long control blocks. During the experimental blocks subjects tapped the right hand index finger for 30 seconds while looking at a cue (the word tap). During the control blocks, subjects rested while looking at a fixation-cross in the center of the screen (Howseman et al., 1997). During the performance of this task, behavioral data pertaining to task performance—including accuracy and reaction times—were collected for each subject. For our statistical analyses, we computed the median of reaction times corresponding to accurate tapping responses by each participant (except for 3 depressed subjects for whom we are missing behavioral data).
2.3 Image Processing and Analysis
The following image processing steps were performed for each subject using SPM5. All functional images were realigned to the first image in the sequence and then co-registered with the subject’s structural grey matter. The co-registered structural MR image and all realigned functional images were normalized to Montreal Neurological Institute (MNI) space using the a priori grey matter template in SPM5. The normalized functional images were smoothed with a Gaussian kernel (full width at half maximum (FWHM) = 10mm) to account for the greater morphologic variability in elderly subjects (Reuter-Lorenz PA and Lustig, 2005). The effect of task on BOLD signal intensity was examined by general linear modeling (GLM) in SPM5. The tapping block was modeled by a box function and convolved with a hemodynamic response function then submitted to the GLM. Prior to the GLM, a high pass filter of 128 seconds was applied to the image to correct low frequency drift. The serial autocorrelation was corrected using an autoregressive model.
Additionally, an automated WMH segmentation method was used to obtain whole-brain WMH volumes from each subject’s T2-weighted FLAIR images (Wu et al., 2006). Acquired WMH volume measurements were then normalized by total brain volume (Wu et al., 2006). In addition to WMHs, ventricles were manually segmented from each subject’s T1-weighted image and the computed volume was also normalized by total brain volume. A final analysis included the computation of a WMH map indicating the number of subjects with WMH in various regions of the white matter above the cerebellum. To obtain this map, each subject’s T2-weighted FLAIR along with the corresponding WMH segmentation was co-registered to the structural image, and all co-registered images were registered to the MNI template.
2.4 Statistical Analysis
First, the general linear model was used to estimate task-related significant BOLD signal changes for each subject. Then, group level analyses were performed using a two-sample t-test, Wilcoxon’s rank-sum tests, and a regression analysis. The two-sample t-test compared the differences in the BOLD signal change between the non-depressed and depressed groups. Due to the skewed distribution of the reaction time and WMH, we performed Wilcoxon rank-sum tests comparing these variables: (1) median reaction times to analyze differences in task-related behavior; and (2) normalized WMH volume measures in the whole brain and in each of the 20 regions from the Johns Hopkins University White Matter Atlas (Wakana et al., 2004) to analyze differences in global and local WMH burden distribution among subjects respectively. Since no significant differences were detected in task-related BOLD signal change, median reaction times, and normalized WMH volumes between the two groups, they were combined. Voxel-wise regression analysis was performed with BOLD signal change on finger-tapping versus fixation as the response variable, and the normalized WMH volume as a predictor. Normalized ventricle volume and group (a dichotomous variable categorizing depressed and non-depressed participants) were also included in the regression analysis as covariates of non-interest. The normalized ventricle volume was included as a covariate to ensure that the results are not biased by ventricle size since large ventricles are associated with high WMH burden and are prone to cause poor registration, which may in turn significantly affect the statistical analysis. Similarly, group was also included as a covariate to control for any group differences. Lastly, we also performed two post-hoc analyses: (1) we performed a Wilcoxon rank-sum test comparing BOLD signal change at the peak coordinate found to be significant in our regression analysis between participants with and without co-localized WMHs within a one-voxel neighborhood of the peak coordinate; and (2) we performed a Spearman’s rank correlation analysis between the medians of reaction times and WMH burden to ensure that the performance of the task was not associated with WMH severity. All statistical parametric analyses were performed in SPM5 and non-parametric tests were performed using MATLAB.
3. Results
No significant task-related difference in BOLD signal change was found between the depressed and non-depressed groups from the two-sample t-test (t(1,72) = 3.0, SPM Family wise error (FWE) corrected p = 0.92). Similarly, no significant group difference was found from the Wilcoxon rank-sum tests comparing median reaction times (z = 0.70, p = 0.48), global normalized WMH volumes (z = −1.78, p = 0.07), and local WMH volume in all 20 regions (z(min,max,std) = (−2.17,−0.03,0.53), p(min,max,std) = (0.03,0.97,0.26); none of them survive Bonferroni correction) between the two groups. For both groups, most subjects (> 80% of the subjects) had a normalized WMH volume within a range of 0 to 0.005 (see Figure 6). Therefore, the non-depressed and depressed groups’ data were pooled.
Figure 6.
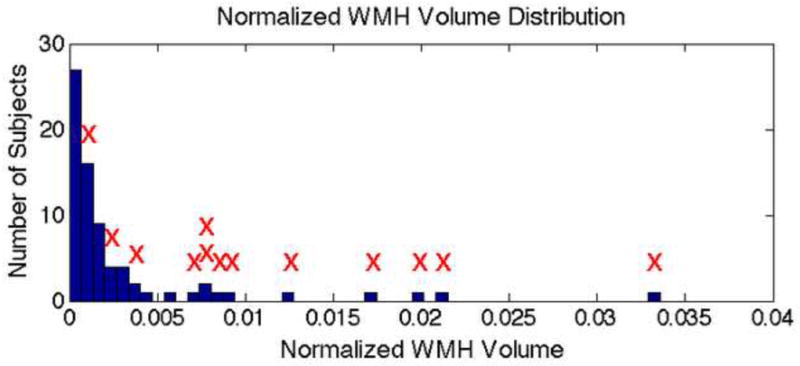
Histogram displaying normalized WMH volume distribution of subjects included in this study. The red “X”s indicate subjects with co-localized WMHs in region of significance from the regression analysis.
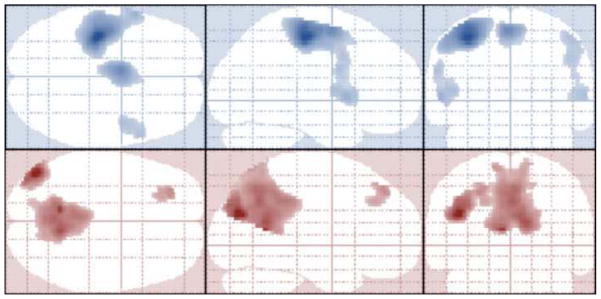
As expected, the group random-effects analysis between all subjects indicate presence of significant positive BOLD signal change in regions of the motor cortex (including primary motor, premotor, and supplementary motor regions) during motor activity of tapping (t(1,73) > 4.48, k = 100, FWE corrected p < 0.05). Additionally, regions known to be a part of the default mode network (including the mid-temporal, prefrontal, and posterior cingulate regions) were significantly deactivated during the tapping task when compared to the baseline fixation period. (t(1,73) > 4.48, k = 100, FWE corrected p < 0.05) predominantly in the left hemisphere (see Figure 3).
Figure 3.
Projected activation maps in neurologic orientation showing significant regions (t(1,73) > 4.48, k = 100, FWE corrected p < 0.05) for main effect of tap (top 3 images in blue) and main effect of fixation (bottom 3 images in red).
The regression analysis results indicate a significant negative correlation (t(1,70) = −5.13, k = 60, FWE corrected p < 0.05, peak coordinate MNI −22 −50 30) between the whole-brain normalized WMH burden and BOLD signal change during finger-tapping (see Figure 4), and no group based significant differences (t(1,70) = 2.92, FWE corrected p = 0.95) were found. The region of significance is located in the parietal white matter and largely overlaps with regions where at least two subjects presented with WMHs as shown in Figure 5. As shown by the histogram in figure 6, essentially all of the subjects with the highest WMH burden have WMH lesions near (within 1 voxel of) the peak of the ROI identified in the fMRI analysis. Although, the overall number of subjects with co-localized WMHs is limited (13 out of 71 subjects), these subjects account for much of the overall WMH burden in the sample (69%). Thus, the distribution of WMH across subjects in this sample does mostly co-localize with fMRI activity. In support of our assertion, the Wilcoxon rank-sum test results also showed significantly greater (z = −3.07, p < 0.005) BOLD signal change in participants with co-localized WMHs within a one-voxel neighborhood of the peak coordinate in the ROI. Also, based on the Spearman’s rank correlation analysis results, there is no significant correlation between median reaction times and WMHs (r = −0.08, r2 = 0.006, t = 0.65, p = 0.52), indicating that the participant’s performance on the task was not significantly associated with WMH severity and thus had no significant affect on the regression analysis results.
Figure 4.
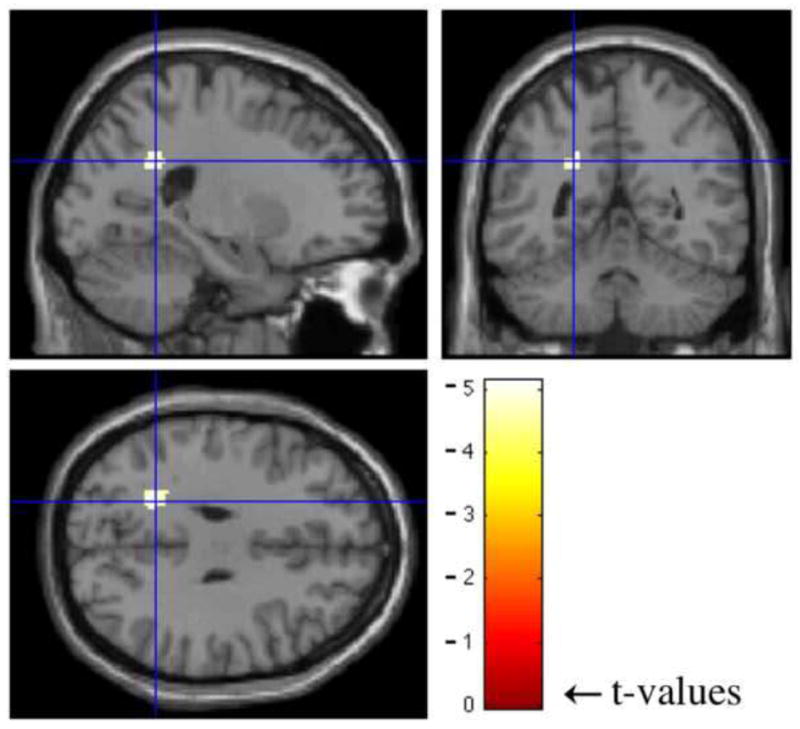
Results of regression analysis performed usign SPM5. Crosshairs indicate the region of significance (t(1,70) = −5.13, k = 60, FWE corrected p < 0.05, peak coordinate MNI −22 −50 30).
Figure 5.
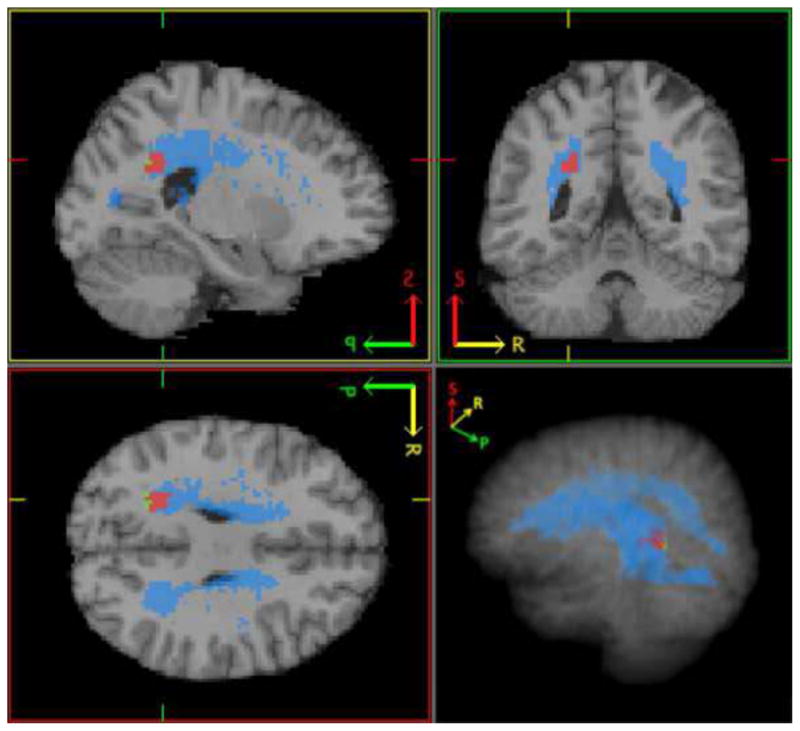
This figure shows the region of significance from the regression analysis (in green), areas where at least 2 subjects had WMHs (in blue), and region of overlap between the two (in red).
4. Discussion
In this study, we found WMH burden in the elderly was inversely associated with BOLD signal change on a simple finger-tapping task in a small region of the white matter. Individuals with higher WMH burden showed a decreased BOLD signal change on tapping (relative to fixation condition). The area of significance was located in the parietal white matter: an area that was not strongly associated with the task based on the BOLD signal analysis, but is nevertheless a region where WMHs are found in several individuals. Thus, it is not clear whether WMHs are associated with a global decrease of BOLD signal change, or perhaps have local effects where the WMHs are most prominent. The significant results in the white matter suggest one of two ideas: fMRI is able to detect BOLD signal change reflective of individual differences in neural activation in the white matter, or the presence of WMHs significantly affects the BOLD MR contrast leading to individual differences not necessarily related to neural activation.
Mazerolle et al., 2008 have shown support for detecting a significant BOLD signal change indicating activation in the white matter. Also, Brickman et al., 2009 studied the cerebral blood flow (CBF) using arterial spin labeling (ASL) and concluded that CBF is significantly lower in WMH laden areas compared to normal appearing white matter and grey matter. If indeed it is possible to generate a detectable BOLD fMRI response in the white matter, our results that show a decrease in BOLD signal change (also indicative of decreased CBF) with an increase in WMH burden, would then be consistent with the conclusions of Mazerolle and Brickman. Our results also would agree with conclusions of other perfusion-weighted MRI studies (Marstrand et al., 2002; Sachdev et al., 2004) with similar pathologies (i.e. hypoperfusion) associated with WMHs.
Nevertheless, detection of the BOLD signal in the white matter is controversial. Two main reasons for this are: 1. Cerebral blood flow and volume are lower in the white matter compared to the grey matter, and 2. Post-synaptic potentials, instead of action potentials, are thought to be associated with the BOLD signal (Gawryluk et al., 2009). Therefore, we believe the stronger argument explaining the significant inverse correlation results is that the T2* BOLD MR contrast is significantly affected by the presence of WMHs. The WMHs are visible on the T2* weighted images and could be significantly affecting preprocessing steps and/or distorting the BOLD signal. Thus, the WMHs and their relation to the functional images need to be further studied. Limitations of this study to fully understand the relation also necessitate future studies. Longitudinal studies and additional BOLD independent studies involving event-related potentials (ERPs) measured using electroencephalogram (EEG), event-related fields (ERFs) measured using magnetoencephalography (MEG), and/or metabolically based 18F-fluorodeoxyglucose positron emission tomography (PET) may help understand the affects of WMHs better. Some other limitations of this study include the limited sample size and the skewed distribution of WMH burden across subjects. An additional limitation is a possible selection bias, which is suggested by the lack of difference in WMH burden between depressed and control subjects. However, since depression is not a variable of interest for the current report, we do not think the possible subject selection influences these results.
Acknowledgments
This research was supported by NIH grants R01- MH076079/MH076079-04S1, MH 086686, KL2 RR024154, R21 NS060184, R37 AG025516 and P30-MH52247/P30 MH71944. It was also supported by the John A. Hartford Center of Excellence in Geriatric Psychiatry at the University of Pittsburgh.
Abbreviations
- WMHs
white matter hyperintensities
- MRI
magnetic resonance imaging
- fMRI
functional magnetic resonance imaging
- BOLD
blood oxygen level dependent
- SPM
Statistical Parametric Mapping software
- FWE
family wise error
- DTI
diffusion tensor imaging
- MDD
major depressive disorder
- FLAIR
fluid attenuated inversion recovery
- GLM
general linear modeling
- FOV
field of view
- TR
repetition time
- TI
inversion time
- TE
echo time
- FA
flip angle
- IPAT
integrated parallel acquisition technique
- MNI
Montreal Neurological Institute
- FWHM
full width at half maximum
- CBF
cerebral blood flow
- ASL
arterial spin labeling
- ERPs
event-related potentials
- EEG
electroencephalogram
- ERFs
event-related fields
- MEG
magnetoencephalography
- PET
positron emission tomography
Footnotes
Publisher's Disclaimer: This is a PDF file of an unedited manuscript that has been accepted for publication. As a service to our customers we are providing this early version of the manuscript. The manuscript will undergo copyediting, typesetting, and review of the resulting proof before it is published in its final citable form. Please note that during the production process errors may be discovered which could affect the content, and all legal disclaimers that apply to the journal pertain.
References
- Aizenstein HJ, Andreescu C, Edelman K, Cochran JL, Price J, Butters MA, Karp J, Patel M, Reynolds CF. fMRI Correlates of White Matter Hyperintensities in Late-Life Depression. American Journal of Psychiatry. 2011;168:1075–1082. doi: 10.1176/appi.ajp.2011.10060853. [DOI] [PMC free article] [PubMed] [Google Scholar]
- Brickman AM, Zahra A, Muraskin J, Steffener J, Holland CM, Habeck C, Borogovac A, Ramos MA, Brown TR, Asllani I, Stern Y. Reduction in cerebral blood flow in areas appearing as white matter hyperintensities on magnetic resonance imaging. Psychiatry Research. 2009;172:117–120. doi: 10.1016/j.pscychresns.2008.11.006. [DOI] [PMC free article] [PubMed] [Google Scholar]
- Carusone LM, Srinivasan J, Gitelman DR, Mesulam MM, Parrish TB. Hemodynamic Response Changes in Cerebrovascular Disease: Implications of Functional MR Imaging. American Journal of Neuroradiology. 2002;23:1222–1228. [PMC free article] [PubMed] [Google Scholar]
- Debette S, Markus HS. The clinical importance of white matter hyperintensities on brain magnetic resonance imaging: systematic review and meta-analysis. British Medical Journal. 2010;341:c3666. doi: 10.1136/bmj.c3666. [DOI] [PMC free article] [PubMed] [Google Scholar]
- DeCarli C, Fletcher E, Ramey V, Harvey D, Jagust WJ. Anatomical Mapping of White Matter Hyperintensities (WMH): Exploring the Relationships Between Periventricular WMH, Deep WMH, and Total WMH burden. Stroke. 2005;36:50–55. doi: 10.1161/01.STR.0000150668.58689.f2. [DOI] [PMC free article] [PubMed] [Google Scholar]
- de Groot JC, de Leeuw FE, Oudkerk M, Van Gijn J, Hofman A, Jolles J, Breteler MM. Cerebral white matter lesions and cognitive function: the Rotterdam Scan Study. Annals of Neurology. 2000;47:145–151. doi: 10.1002/1531-8249(200002)47:2<145::aid-ana3>3.3.co;2-g. [DOI] [PubMed] [Google Scholar]
- Friston K, Holmes AP, Worsley KJ, Poline JP, Frith CD, Frackowiak RSJ. Statistical Parametric Maps in functional imaging: A general linear approach. Human Brain Mapping. 1995;2:189–210. [Google Scholar]
- Gawryluk JR, Brewer KD, Beyea SD, D’Arcy RCN. Optimizing the detection of white matter fMRI using asymmetric spin echo spiral. NeuroImage. 2009;45:83–88. doi: 10.1016/j.neuroimage.2008.11.005. [DOI] [PubMed] [Google Scholar]
- Gunning-Dixon FM, Brickman AM, Cheng JC, Alexopoulos GS. Aging of cerebral white matter: a review of MRI findings. International Journal of Geriatric Psychiatry. 2009;24:109–117. doi: 10.1002/gps.2087. [DOI] [PMC free article] [PubMed] [Google Scholar]
- Hedden T, Van Dijk KRA, Shire EH, Sperling RA, Johnson KA, Buckner RL. Failure to Modulate Attentional Control in Advanced Aging Linked to White Matter Pathology. Cerebral Cortex. 2011:bhr172v1–bhr172. doi: 10.1093/cercor/bhr172. [DOI] [PMC free article] [PubMed] [Google Scholar]
- Howseman AM, Josephs O, Rees G, Friston KJ. SPM course, short course notes. 1997. Special Issues in Functional Magnetic Resonance Imaging. [Google Scholar]
- Linortner P, Fazekas F, Schmidt R, Ropele S, Pendi B, Petrovic K, Loitfelder M, Neuper C, Enzinger C. White matter hyperintensities alter functional organizationof the motor system. Neurobiology of Aging. 2012;33:197.e1–197.e9. doi: 10.1016/j.neurobiolaging.2010.06.005. [DOI] [PubMed] [Google Scholar]
- Madden DJ, Bennett IJ, Song AW. Cerebral White Matter Integrity and Cognitive Aging: Contributions from Diffusion Tensor Imaging. Neuropsychology Review. 2009;19:415–435. doi: 10.1007/s11065-009-9113-2. [DOI] [PMC free article] [PubMed] [Google Scholar]
- Marstrand JR, Garde E, Rostrup E, Ring P, Rosenbaum S, Mortensen EL, Larsson HBW. Cerebral Perfusion and Cerebrovascular Reactivity Are Reduced in White Matter Hyperintensities. Stroke. 2002;33:972–976. doi: 10.1161/01.str.0000012808.81667.4b. [DOI] [PubMed] [Google Scholar]
- Mazerolle EL, D’Arcy RCN, Beyea SD. Detecting functional magnetic resonance imaging activation in white matter: Interhemispheric transfer across the corpus callosum. Biomed Central Neuroscience. 2008;9:84. doi: 10.1186/1471-2202-9-84. [DOI] [PMC free article] [PubMed] [Google Scholar]
- Nordahl CW, Ranganath C, Yonelinas AP, Decarli C, Fletcher E, Jagust WJ. White matter changes compromise prefrontal cortex function in healthy elderly individuals. Journal of Cognitive Neuroscience. 2006;18:418–429. doi: 10.1162/089892906775990552. [DOI] [PMC free article] [PubMed] [Google Scholar]
- Reuter-Lorenz PA, Lustig C. Brain aging: reorganizing discoveries about the aging mind. Current Opinion in Neurobiology. 2005;2:245–251. doi: 10.1016/j.conb.2005.03.016. [DOI] [PubMed] [Google Scholar]
- Rossini PM, Altamura C, Ferretti A, Vernieri F, Zappasodi F, Caulo M, Pizzella V, Del Gratta C, Romani GL, Tecchio F. Does cerebrovascular disease affect the coupling between neuronal activity and local haemodynamics? Brain. 2004;127:99–110. doi: 10.1093/brain/awh012. [DOI] [PubMed] [Google Scholar]
- Sachdev P, Wen W, Shnier R, Brodaty H. Cerebral Blood Volume in T2-Weighted White Matter Hyperintensities Using Exogenous Contrast Based Perfusion MRI. Journal of Neuropsychiatry Clinical Neuroscience. 2004;16:83–92. doi: 10.1176/jnp.16.1.83. [DOI] [PubMed] [Google Scholar]
- Taylor WD, Payne ME, Krishnan RR, Wagner HR, Provenzale JM, Steffens DC, MacFall JR. Evidence of White Matter Tract Disruption in MRI Hyperintensities. Biological Psychiatry. 2001;50:179–183. doi: 10.1016/s0006-3223(01)01160-x. [DOI] [PubMed] [Google Scholar]
- Vernooij MW, Ikram MA, Vrooman HA, Wielopolski PA, Krestin GP, Hofman A, Niessen WJ, van der LA, Breteler MM. White matter microstructural integrity and cognitive function in a general elderly population. Archives of General Psychiatry. 2009;66:545–553. doi: 10.1001/archgenpsychiatry.2009.5. [DOI] [PubMed] [Google Scholar]
- Wen W, Sachdev P. The topography of white matter hyperintensities on brain MRI in healthy 60- to 64-year-old individuals. NeuroImage. 2004;22:144–154. doi: 10.1016/j.neuroimage.2003.12.027. [DOI] [PubMed] [Google Scholar]
- Wakana S, Jiang H, Nagae-Poetscher LM, van Zijl PCM, Mori S. Fiber tract–based atlas of human white matter anatomy. Radiology. 2004;230:77–87. doi: 10.1148/radiol.2301021640. [DOI] [PubMed] [Google Scholar]
- Wu M, Rosano C, Butters M, Whyte E, Nable M, Crooks R, Meltzer CC, Reynolds CF, Aizenstein HJ. A fully automated method for quantifying and localizing white matter hyperintensities on MR images. Psychiatry Research: Neuroimaging. 2006;148:133–142. doi: 10.1016/j.pscychresns.2006.09.003. [DOI] [PMC free article] [PubMed] [Google Scholar]


