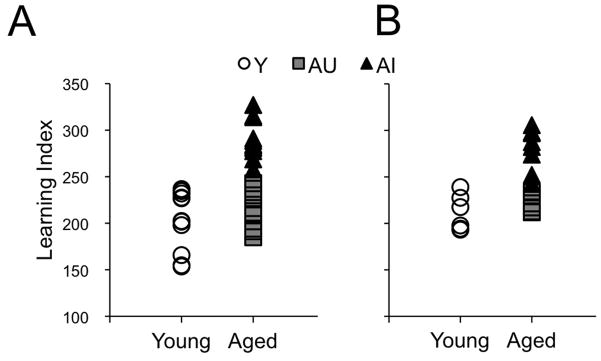
Figure 1.
Learning index scores for the individual animals. (A) Scores for the animals used in the immunohistochemical experiments. Aged animals with scores comparable to young (Y, white circles, n=11) were classified as unimpaired (AU, grey squares, n=9) and aged animals with scores outside the Y distribution were classified as impaired (AI, black triangles, n=11). (B) Scores for the animals used in the western blotting experiments (Y, n=6; AU, n=6; AI, n=8).

