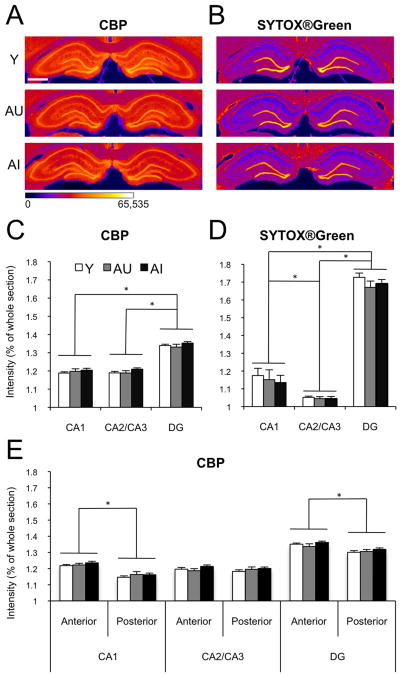
Figure 2.
CBP baseline immunofluorescence in the principal cell layers of the hippocampus, imaged on the Typhoon Trio+ system and quantified on ImageJ. (A) Representative CBP immunofluorescent images from one young (Y), one aged unimpaired (AU) and one aged impaired (AI) animal. The images were collected as 16-bit gray scale (0–216 intensity scale) and pseudo-colored for optimal delineation of the regions of interest. Scale bar = 1mm. (B) SYTOX®Green nucleic acid counterstain of the same sections as in A, processed in the same way. (C) Average intensity of CBP immunofluorescence in the principal cell layers of CA1, CA2/CA3 and DG of Y (white bars, n=11), AU (gray bars, n=9) and AI (black bars, n=11) animals, normalized to whole section CBP intensity. (D) Average intensity of the SYTOX®Green counterstain in the same animals as represented in C. (E) Average intensity of CBP immunofluorescence across the anterior-posterior axis of the hippocampus. Error bars represent standard error of the mean. *p<0.01 (repeated measures ANOVA with Bonferroni post-hoc test).

