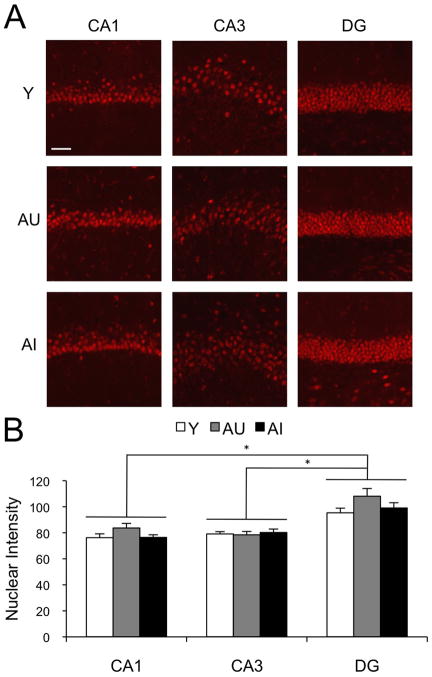
Figure 4.
Confocal CBP immunofluorescence images and quantification. (A) Representative images from the CA1, CA3 and DG of young (Y), aged unimpaired (AU) and aged impaired (AI) animals. The images were collected as 8-bit gray scale (0–28 intensity scale). Scale bar = 50μm. Brightness and contrast settings adjusted in the same way for all images and for presentation purposes only. (B) Average intensity of CBP immunofluorescence in the nuclei of the hippocampal subfield of Y (white bars, n=11), AU (gray bars, n=9) and AI (black bars, n=11) animals. Threshold was adjusted prior to quantification, in order to quantify nuclear labeling only. Error bars represent standard error of the mean. *p<0.01 (repeated measures ANOVA with Bonferroni post-hoc test).

