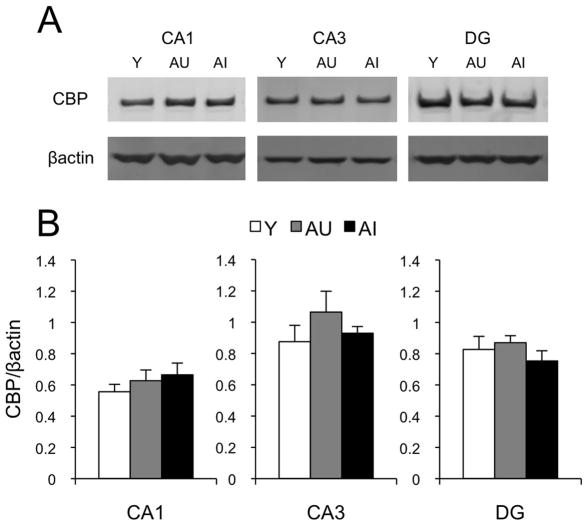
Figure 5.
Quantification of CBP levels by Western Blot. (A) Representative blots for CBP protein from micro-dissected hippocampal sub-regions CA1, CA3 and DG of young (Y), aged unimpaired (AU) and aged impaired (AI) animals. βactin was used as a loading control. (B), Average CBP protein levels, normalized to βactin in Y (n=6), AU (n=6) and AI (n=8) animals. Error bars represent the standard error of the mean. No significant differences were found.

