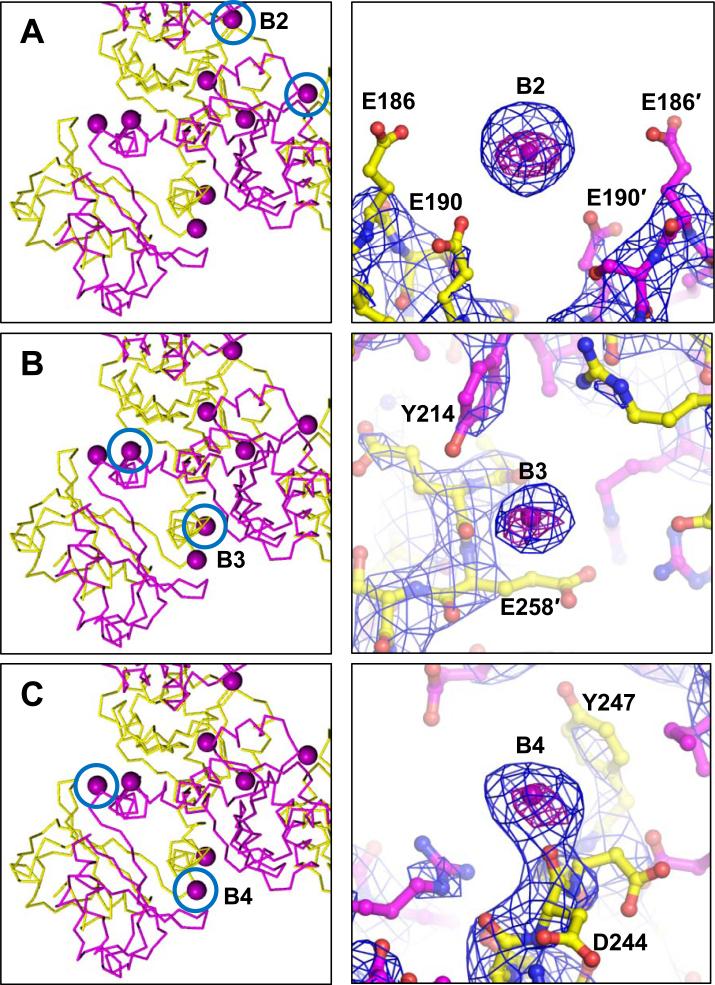
Figure 2. Ba2+ sites in the MthK gating ring cavity and cleft region.
Locations of Ba2+ sites in the RCK domain are indicated by blue circles (left panels); representative sites are shown as ball-and-stick (right panels), overlayed with NCS-averaged 2Fo-Fc maps (blue mesh) and anomalous difference maps (purple mesh). A, Ba2+ site in the gating ring cavity determined by E190 residues from adjacent subunits (indicated by ′) Ba2+-O distances in Å: E190(Oε2), 4.9; E190′(Oε), 4.9. B, Ba2+ site determined by the Y214 sidechain and E258 carbonyl from adjacent subunits. Ba2+-O distances in Å: Y214(OH), 4.6; E258′(O), 4.5. C, Ba2+ site determined by the main-chain carbonyl of D244. Ba2+-O distance to D244(O), 2.6 Å. NCS-averaged 2Fo-Fc maps are contoured at 5σ; NCS-averaged anomalous difference maps are contoured at 20σ (A, C) or 14σ (B). See also Figure S2.

