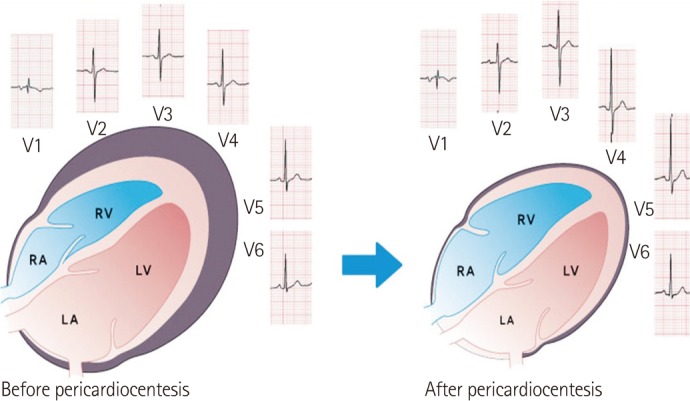
Fig. 2.

Schematic showing that pericardial effusion mainly accumulates around the 2 ventricles, rather than the 2 atria; therefore, the p waves are not changed much after pericardiocentesis, compared with the Q wave (Jung HO et al. Am J Cardiol 2010;106:441 with permission).18) RA: right atrium, LA: left atrium, RV: right ventricle, LV: left ventricle.
