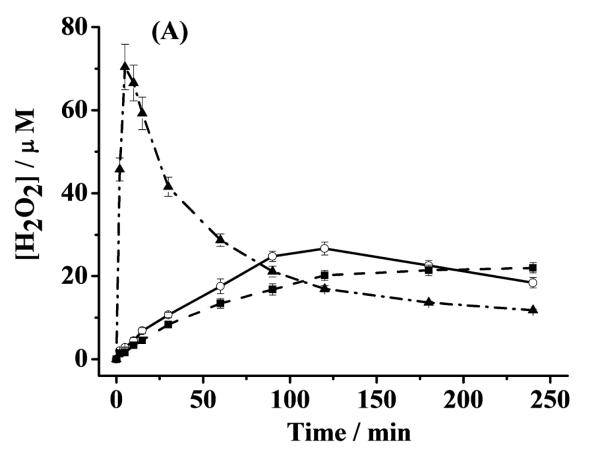
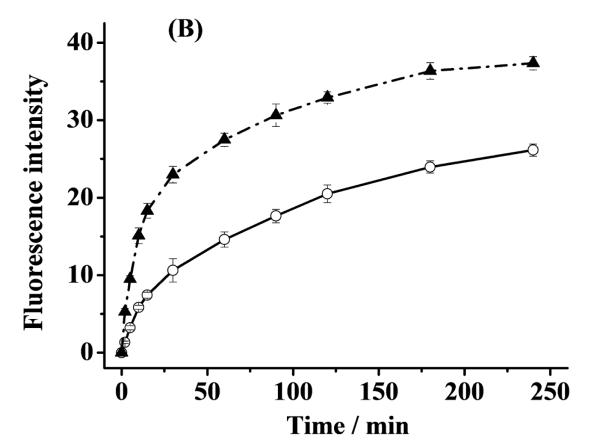
Fig. 5.
(A) Concentrations of H2O2 generated by α-helical α-syn–Cu(II)(dashed curve), unstructured α-syn–Cu(II)(solid curve) and free Cu(II) (dash-dotted curve). [AA], [α-syn] and [Cu(II)] were 200, 10 and 5 μM, respectively. (B) Changes of [OH•] plotted as the 7-OHCCA fluorescence intensity in the presence of free Cu(II) (5 μM; dash-dotted curve) and the Cu(II) complex of unstructured α-syn (solid curve; 5 μM Cu(II) and 10 μM α-syn). Both solutions contained 200 μM AA and 1 mM 3-CCA. The error bars are relative standard deviations of three replicates.


