
Figure 1.
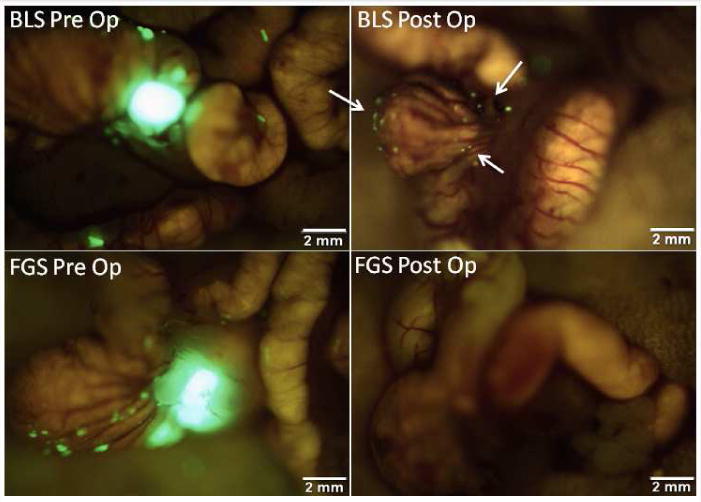
Pre- and postoperative images under FGS and BLS in an orthotopic mouse model. These are representative pre- and postoperative images of a mouse from the BLS group (top panel) and the FGS group (bottom panel). The enhanced ability to visualize and identify tumor margins under fluorescence-guidance permitted a more complete resection. All mice in the FGS group underwent an R0 resection while only 58% of mice in the BLS group had no evidence of residual fluorescent tumor on postoperative images (arrows in right upper panel) (p=0.001).