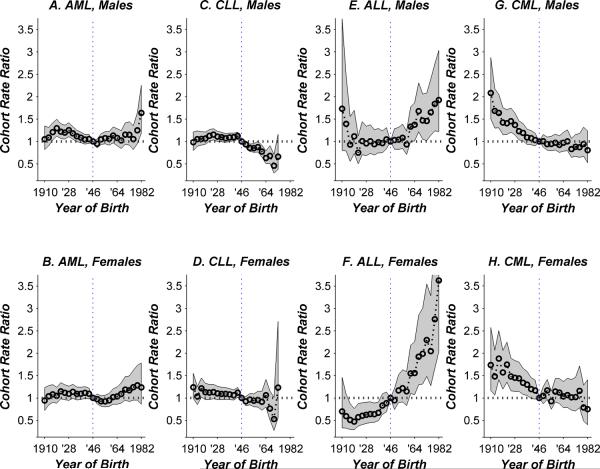
Figure 2.
Cohort rate ratio curves by type of leukemia and sex, relative to the experience of the 1946 reference birth cohort, as described in Methods. Shaded regions show point-wise 95% confidence limits. Horizontal dotted line shows rate ratio of 1 (no difference between given cohort and reference cohort). Vertical dotted line marks the 1946 reference cohort.

