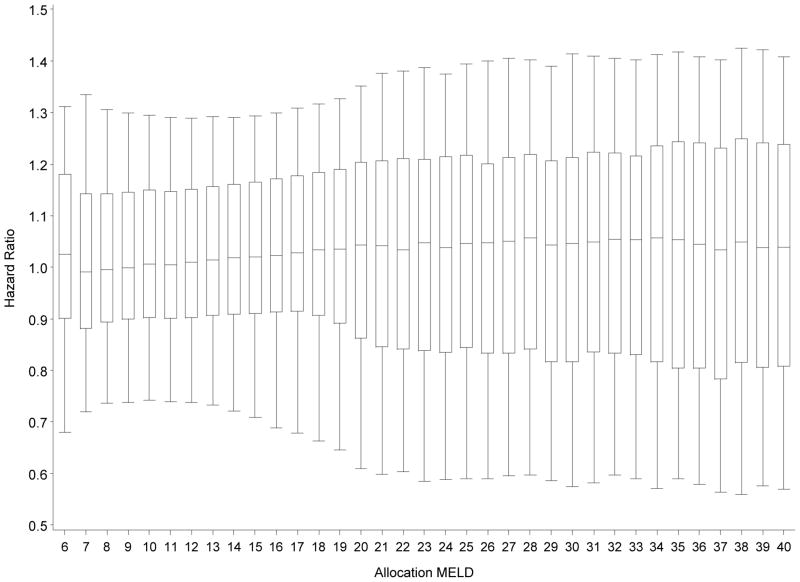
Figure 2. MELD score-specific box-whisker plots of the DDLT hazard ratios (HR).
The HR’s are estimated using a model stratified by MELD, DSA, blood type and intestine-listing policy. Candidate-specific HRs estimated using all remaining covariates and scaled by their MELD score specific means such that they average to 1. Within each MELD score, the box represents the 75th and 25th percentiles, while the whiskers denote the 95th and 5th percentile. The line in the middle of the box denotes the median, which tends to be very close to 1 since the HRs within each MELD score were scaled such that they average to 1. If MELD score was the only factor (other than DSA, blood type and liver/intestine policy) to affect DDLT rates, then there would be no distribution of HRs; within a given MELD score, each candidate would have the same predicted DDLT rate which, after scaling, would equal 1. The whiskers within each MELD score-specific distribution of HRs reflects the systematic heterogeneity in DDLT rates due to various candidate factors.

