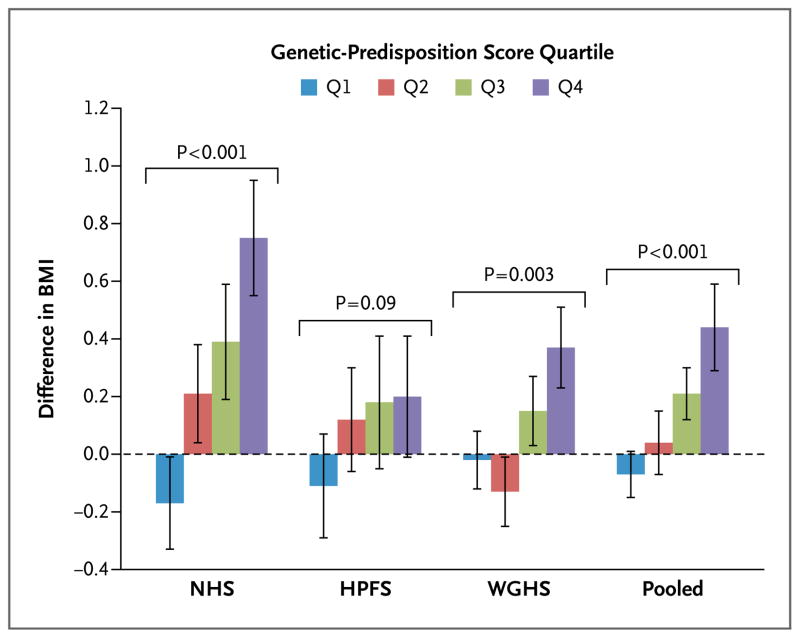
Figure 2. Difference in BMI Associated with One Serving of a Sugar-Sweetened Beverage per Day, According to the Quartile of the Genetic-Predisposition Score.
Data are effect sizes (β coefficients [±SE]) of sugar-sweetened beverage intake (one serving per day) on body-mass index (BMI; the weight in kilograms divided by the square of the height in meters), stratified according to the quartile of the genetic-predisposition score. In the NHS cohort, the median scores across the quartiles were 24.5 (range, 13.1 to 26.3), 27.8 (range, 26.4 to 29.0), 30.3 (range, 29.1 to 31.7), and 33.6 (range, 31.8 to 43.4); in the HPFS cohort, 24.9 (range, 16.0 to 26.5), 27.9 (range, 26.6 to 29.1), 30.4 (range, 29.2 to 31.7), and 33.6 (range, 31.8 to 41.9); and in the WGHS cohort, 24.7 (range, 15.3 to 26.5), 27.8 (range, 26.6 to 29.1), 30.3 (range, 29.2 to 31.6), and 33.4 (range, 31.7 to 43.4). In the NHS and HPFS cohorts, the analyses were based on data from the first 4 years in women (1980 to 1984) and men (1986 to 1990), respectively, with adjustment for age, source of genotyping data, level of physical activity, time spent watching television, status with respect to current smoking, alcohol intake, and Alternative Healthy Eating Index score. In the WGHS cohort, the analyses were based on data from the first 3 years, with adjustment for age, geographic region, eigenvectors, level of physical activity, status with respect to current smoking, and alcohol intake. P values are for interaction. I bars indicate standard errors.

