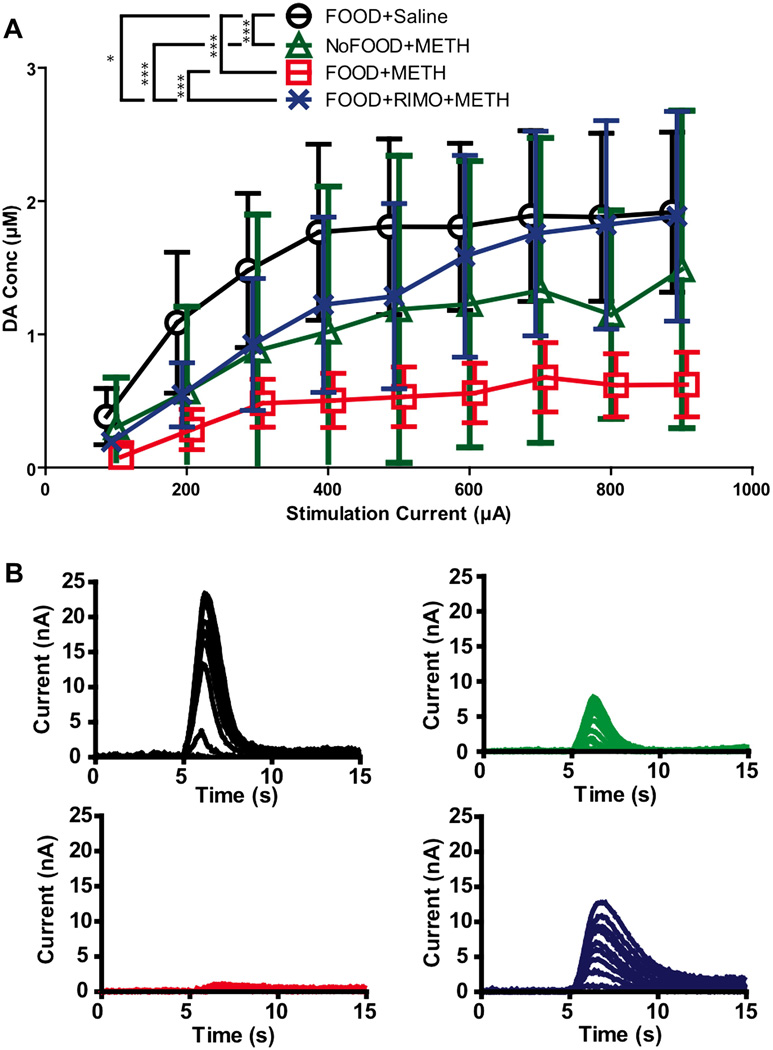
Figure. 5.
Input-output experiment: effects of METH and rimonabant. A, VTA stimulation current (100–900µA) vs. peak dopamine concentration in the NAc. (Mean ±SEM, Repeated Measures, One-Way ANOVA, Bonferroni’s post hoc test). B, Representative within- subject input output experiment plotted in current vs. time traces. Colors from A indicate group. Points are shifted in reference to NoFOOD+METH to display error bars: FOOD+Saline 6 points shifted right, FOOD+RIMO+METH 3 points shifted right, FOOD+METH is 3 points shifted left, NoFOOD+METH no shift. Differences in averaging are responsible for discrepancy between figure 5 and 3: FOOD+METH displays non significant but greater average peak amplitudes in the depth analysis, where values were averaged between subject within a group at each depth and analyzed by one-way ANOVA; NoFOOD+METH displays higher peak amplitudes in Figure 3 as it was analyzed by a two-way ANOVA as data was obtained from only one depth for each subject. [*p<.05, **p<.01,***p<.001]

