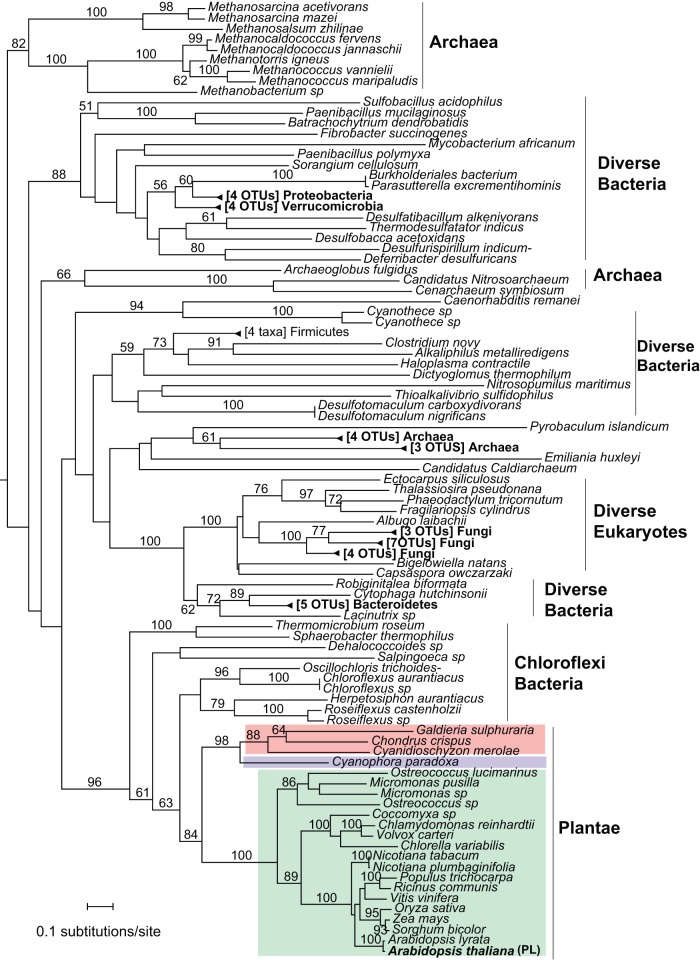
Figure 4. Phylogenetic analysis of the plastid histidinol-phosphate aminotransferase (At1g71920.1).
The numbers at the nodes indicate RaxML bootstrap values (only values >50% are shown). Branch lengths are proportional to the number of substitutions per site (see the scale bars). Colored boxes highlight Plantae lineages. PL, plastid localized protein.

