Figure 1.
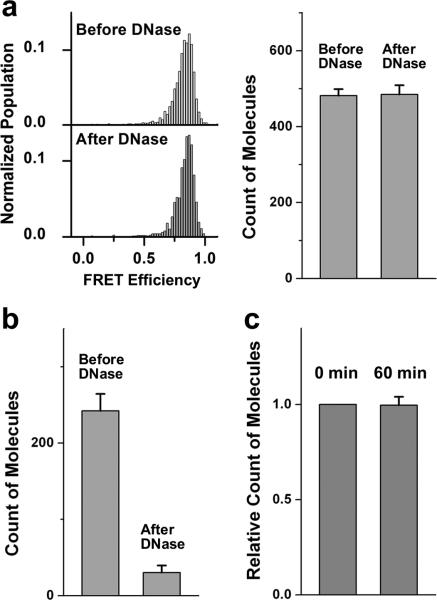
Stable encapsulation of DNA probes inside SNARE protein reconstituted vesicles. (a) Histograms of FRET efficiency, E, (left) and average numbers (right) of molecules per imaging area (25 μm X 50 μm) before and after a DNase treatment of DNA probes encapsulated inside surface immobilized v-SNARE (protein:lipid = 1:200) vesicles. For histograms of FRET efficiency, Y-axis is normalized population, where we divided the distribution by the total number of vesicles measured and X-axis is FRET efficiency value. (b) Average count of molecules per imaging area before and after a DNase treatment of DNA probes immobilized outside vesicles. (Corresponding representative images for (a) and (b) are shown in Supplementary Fig. S2.) (c) Relative count of molecules per imaging area for surface immobilized v-vesicle encapsulating DNA probes after incubating at 37°C for 60 min. The number of molecules at 0 min was set as 1. Error bars denote the standard error.

