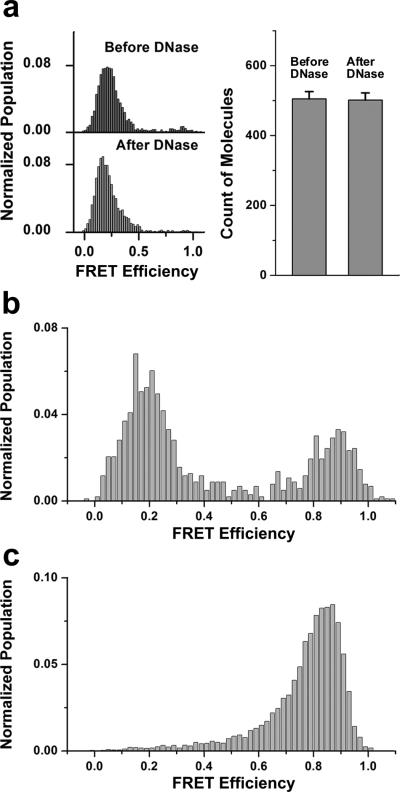
Figure 3.
Various controls to establish the single vesicle content mixing assay. (a) DNA annealing take place inside vesicles. E distributions (left) and average numbers of molecules per imaging area (25 μm X 50 μm) (right) of fusion products before and after a DNase treatment. Error bars denote standard error. Corresponding representative images are shown in Supplementary Fig. S6. (b) E distribution of the fusion product with 1 μM Sec9c performed in the bulk solution and subsequently immobilized on the quartz surface for observation. DNase treatment was applied to both v- and t-vesicles to eliminate free DNA molecules before reaction. (c) E distribution after fusion reaction using non-complementary poly-T DNA inside t-vesicles.

