
Figure 1. WebQTL interval mapping reveals genetic control of gene expression.
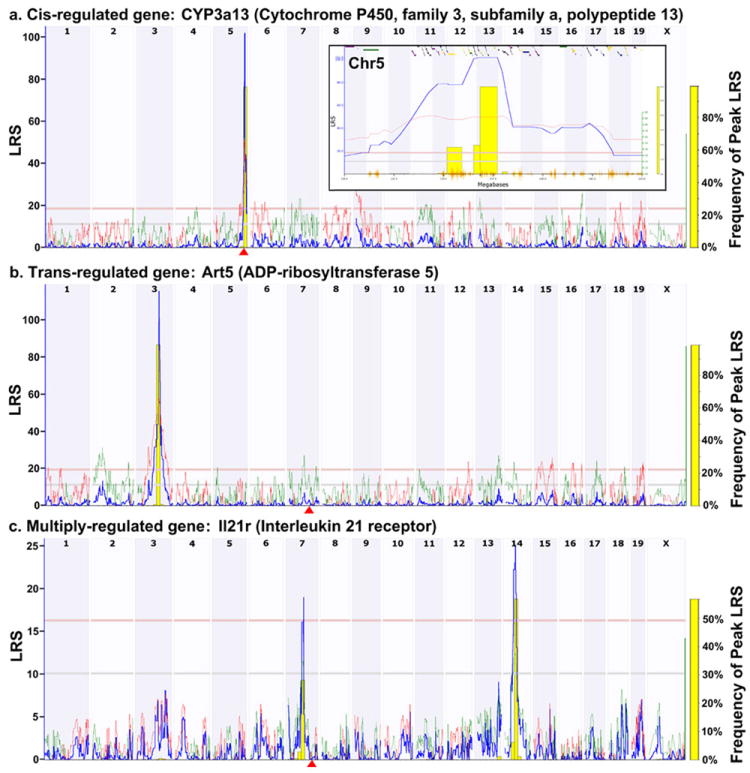
a, An example of a cis-regulated gene (Cyp3a13) where the QTL is co-located with the gene. The horizontal axis displays the mouse genome. The vertical axis displays the Likelihood Ratio Statistic (LRS), The gene location is shown by the red triangle. The red horizontal line indicates a significant level of association as determined by permutation analysis. The grey horizontal line below it represents a suggestive association. The blue line displays the LRS along the genome and the yellow bars are the results of a bootstrap analysis. The inset shows a zoomed-in view of the Cyp3a13 QTL on Chr5 (130-145Mb) and illustrates the features of WebQTL. The red line indicates that C57BL/6J alleles at the marker increase expression of the gene. The colored boxes along the top represent known genes which, when selected, will take the user to the NCBI EntrezGene entry for that gene. A SNP track is displayed along the bottom as an orange seismogram. b, An example a trans-regulated gene (Art5). c, An example of a gene (Il21r) that is regulated by multiple loci.