
Figure 4. Chr12 locus is a master-regulator of gene expression in mouse liver.
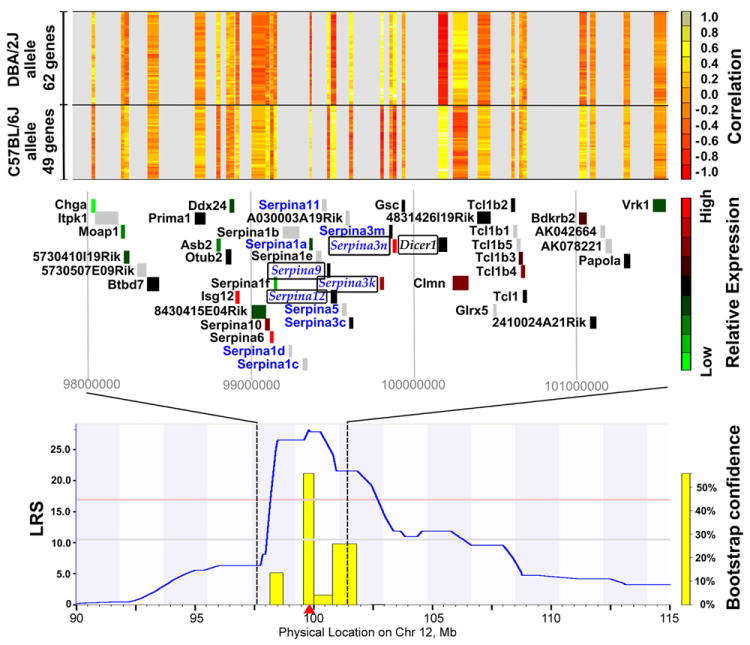
A zoomed-in view of the region on Chr12 that controls a large number of trans-regulated transcripts is shown in the bottom panel. The middle panel is a detail of the QTL peak from 98 Mb to 102 Mb showing the genes in this region. Genes labeled in blue text have non-synonymous coding SNPs. Genes in italics are cis-regulated. Genes in plain text are trans-regulated. The gene location marker is color coded based on relative expression in the mouse liver. Green indicates low expression; red indicates high expression; grey indicates that the gene is not represented on the microarray. The top panel shows the correlation between the expression of each gene located in this locus and the putative trans-regulated genes. Red indicates negative correlation; yellow indicates positive correlation; grey indicates no information. Genes in the upper part of the panel are highly expressed in strains with the DBA/2J allele at this Chr12 locus. Genes on the bottom of the panel are highly expressed in strains with the C57BL/6J allele is at this locus.