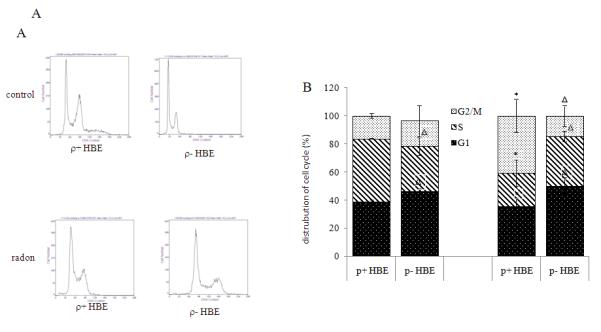
Figure 5.

Radon-irradiation effect on cell cycle in ρ+ HBE cells. The cells were labeled with a solution of PBS (pH 7.4) containing 25 mg/ml PI, 0.1 mM EDTA and 0.01 mg/ml DNase-free RNase. The samples were incubated for 15 min at room temperature. (A) Histograms of distribution of DNA content with flow cytometry in ρ− and ρ+ HBE cells. (B) The % cells within different cells stages were analyzed by flow cytometry. Data presented are representative of three experiments.
Data are expressed as means ± S.D.
*, p<0.05, compared to control cells
Δ, p<0.05, compared to ρ+ cell.
