Figure 1.
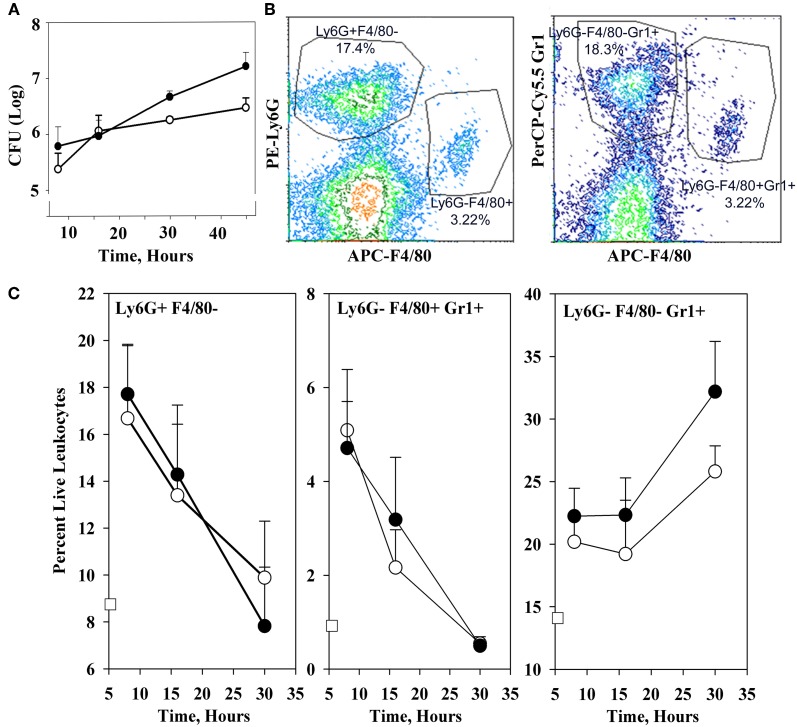
Infection dynamics and host cellular responses in spleen in the high-dose systemic plague model. C57BL/6 mice were infected intravenously with a dose of 106 of the parent Y. pestis KIM5 (closed circles) or the ΔyopM-1Y. pestis KIM5-3002 (open circles) that had been induced for expression of thermally-upregulated properties for 3 h at 37°C. Bacterial burdens were determined as CFU Panel (A). Bacterial numbers differed significantly for parent and ΔyopM-1 Y. pestis at 30 and 45 h p.i. (P <10−4 and P < 10−2, respectively). Splenic leukocytes were stained with fluorochrome-conjugated antibodies against the surface markers Ly6G, F4/80, and Gr1 as well as the dye EMA which stains cells that have lost membrane integrity, and analyzed by flow cytometry. Panel (B) illustrates the gating strategy used to define and quantify several host cell populations as percent live leukocytes. Panel (C) shows how the percent of EMA− (i.e., “live”) leukocytes changed over 30 h of infection for three inflammatory cell types of relevance to the host response to Y. pestis. Values for non-infected mice are given by the open squares on the ordinates. Percentages of Ly6G+ F4/80− PMNs at 16 h were significantly different from those at 8 h for mice infected with the ΔyopM-1 strain (P < 0.05 by student's t-test); those at 30 h differed significantly from 8 h for infections by both Y. pestis strains (P < 10−2 for parent and P < 10−4 for ΔyopM-1). For Ly6G− F4/80+ Gr1+ MOs, percentages at both 16 and 30 h differed significantly from those at 8 h for both infections (parent: P < 0.05 for 16 h, P < 10−5 for 30 h; ΔyopM-1: P < 10−2 for 16 h, P < 10−5 for 30 h). For the Ly6G− F4/80− Gr1+ population, percentages differed only for 30 compared to 8 h p.i. (P < 10−2 for parent Y. pestis and P < 10−3 for ΔyopM-1). Each datum point gives the averages ± standard deviation (SD) for pooled data from six mice in two independent experiments.

