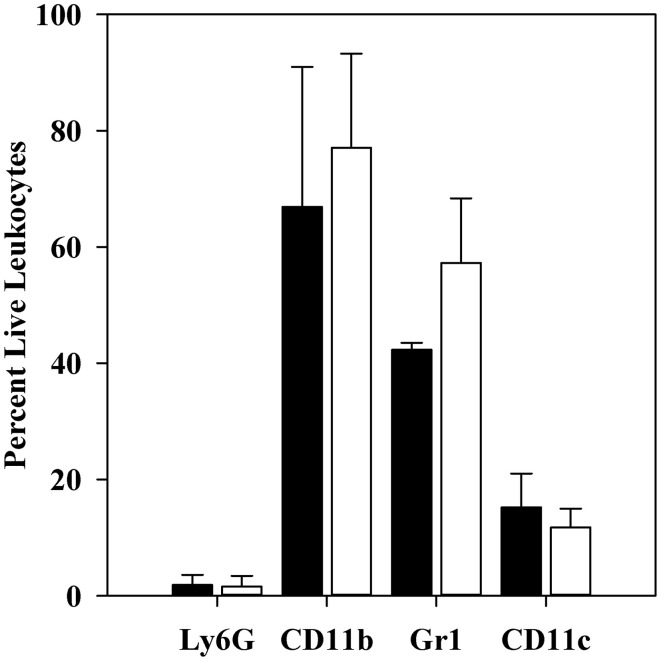
Figure 3.
Flow cytometric analysis of CD11b+ cell populations after 1 h infection. C57BL/6 mice were infected for 1 h with 106 thermally-induced parent or ΔyopM-1 Y. pestis, and CD11b+ cells were obtained from spleens as described in the legend to Figure 2. Samples were analyzed by flow cytometry for the presence of Ly6G, CD11b, Gr1, CD11c, and for staining by EMA. The bars represent the averages ± SD of the percent live leukocytes. Solid bars, mice infected with parent Y. pestis (pooled data from two experiments and 8 mice); open bars, mice infected with ΔyopM-1 Y. pestis (pooled data from three experiments and 12 mice).

