FIGURE 7.

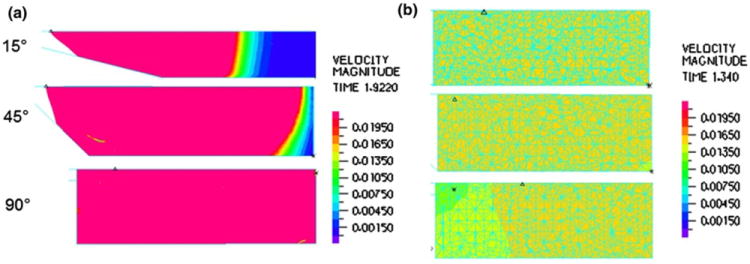
Velocity band plots for the 15°, 45°, and 90° CFD TAL models at peak systole in the (a) inlet housing region and (b) fiber bundle.

Velocity band plots for the 15°, 45°, and 90° CFD TAL models at peak systole in the (a) inlet housing region and (b) fiber bundle.