FIGURE 1.
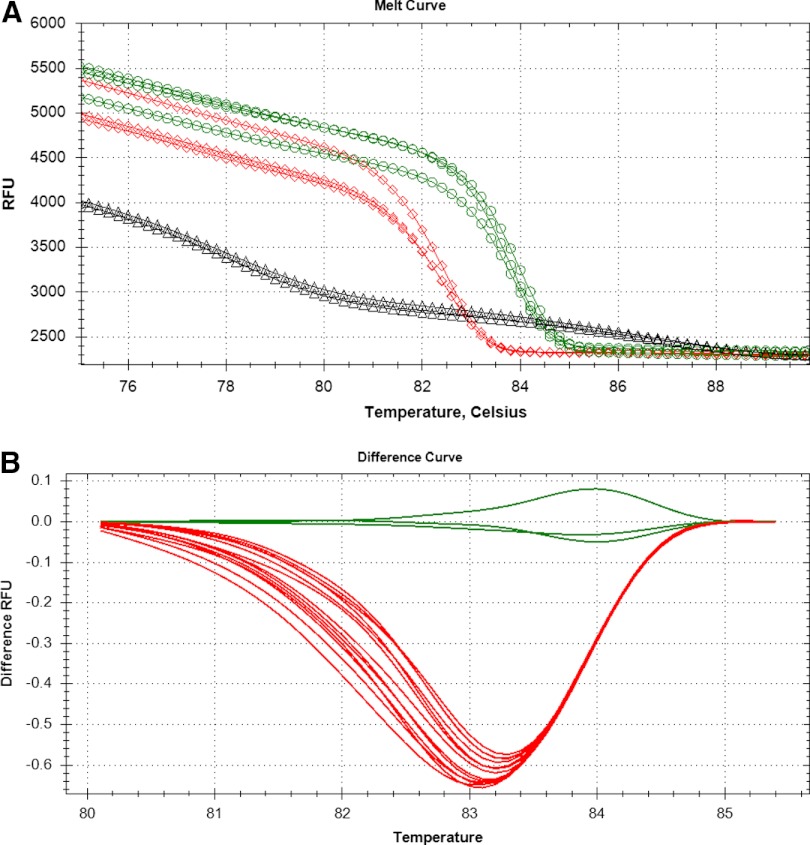
HRM analysis of Anopheles sp. based on X-chromosome-based rDNA amplicons. The data from the same samples are displayed in A and B. (A) Raw melt-curve data. Green lines with circles are from An. gambiae, red lines with diamonds are from An. arabiensis, and black lines with triangles are from water (negative control). (B) The difference-melt curves normalized to the cluster An. gambiae. The negative control is not present in B as a result of the absolute signal being too low for comparison. RFU, Relative fluorescence units.

