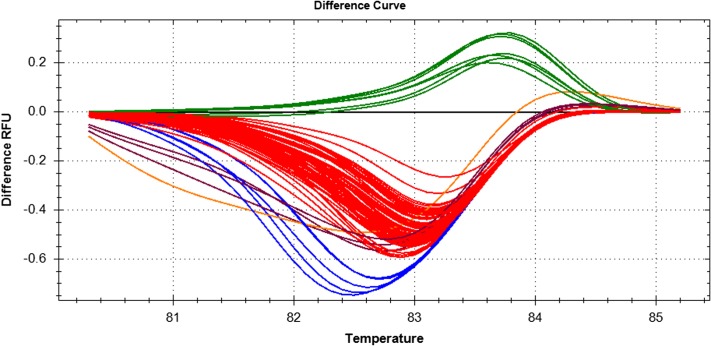
FIGURE 4.
Difference curves for multiple individuals from the field, including positive control samples for An. arabiensis and An. gambiae. Of the 86 unknowns that were tested, four are An. gambiae, i.e., at or above 0.0; 81 are An. arabiensis, i.e., below 0.0; and one is a putative hybrid (black line), in between the two clusters. Each color, six in total, represents a different cluster, with each member having a confidence value of 0.95 or higher on a scale of 0.0 to 1.0. Temperature is Celsius.

