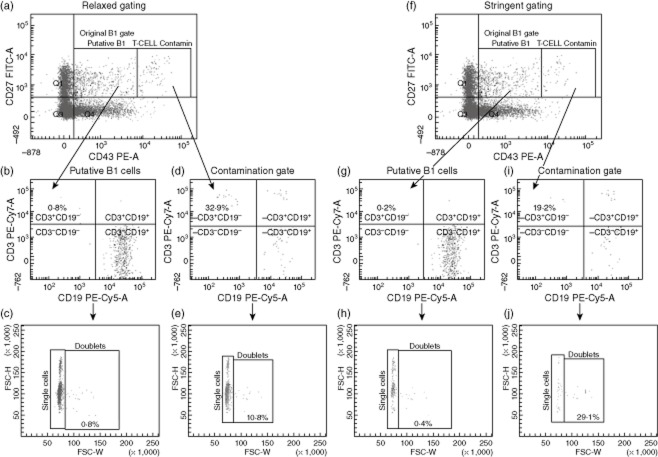
Fig. 3.
Determination of CD20+CD27+CD43lo–int putative B1 cell and CD20+CD27+CD43hi contaminant cell CD3 expression and doublet status. Cells from healthy control samples were gated using either a relaxed CD20 gate (a) or a strict CD20 gate (f). CD20+CD27+CD43lo–int putative B1 cells were analysed in both scenarios for CD3 and CD19 expression (b,g). CD20+CD27+CD43hi contamination cells from both scenarios were also measured for CD3 and CD19 expression (d,i). Percentage doublet cells in each region were measured by forward-scatter–pulse width (FSC-W). The respective doublet plot is shown beneath the CD3/CD19 plot (c,e,h,j). A representative plot is shown (n = 13).

