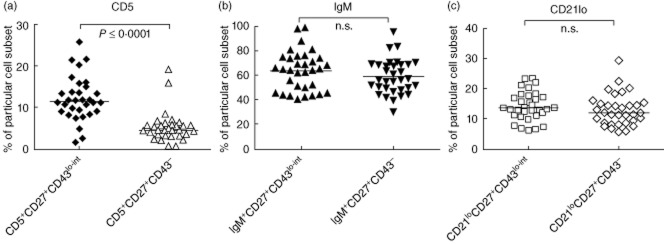
Fig. 4.
Median percentage of CD20+CD27+CD43lo–int or CD20+CD27+CD43– cells expressing either CD5+, CD21lo or IgM+ in healthy controls (n = 33). Whole blood was stained as stated in the Methods. Cells were gated as described in Fig. 2. Scatter graphs show individual percentage values for CD5+ (a), IgM+ (b) or CD21lo (c) cells within the CD20+CD27+CD43lo–int and CD20+CD27+CD43– subpopulations.

