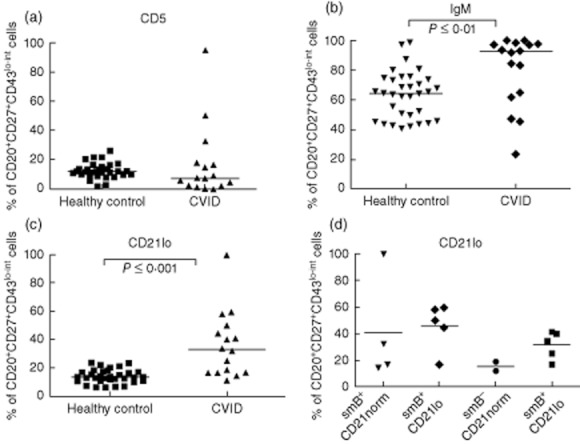
Fig. 6.

Percentage of CD20+CD27+CD43lo–int cells expressing either CD5, IgM or CD21lo in CVID patients compared to healthy controls. Whole blood was stained as stated in the Methods. Cells were gated as described in Fig. 2. Percentage of CD20+CD27+CD43lo–int cells in common variable immunodeficiency (CVID) patients (n = 16) and healthy controls (n = 33) expressing either CD5 (a), immunoglobulin (Ig)M (b) or CD21lo (c). (d) Percentage of CD20+CD27+CD43lo–int cells expressing CD21lo in CVID patients stratified into respective EUROclass classification groups.
