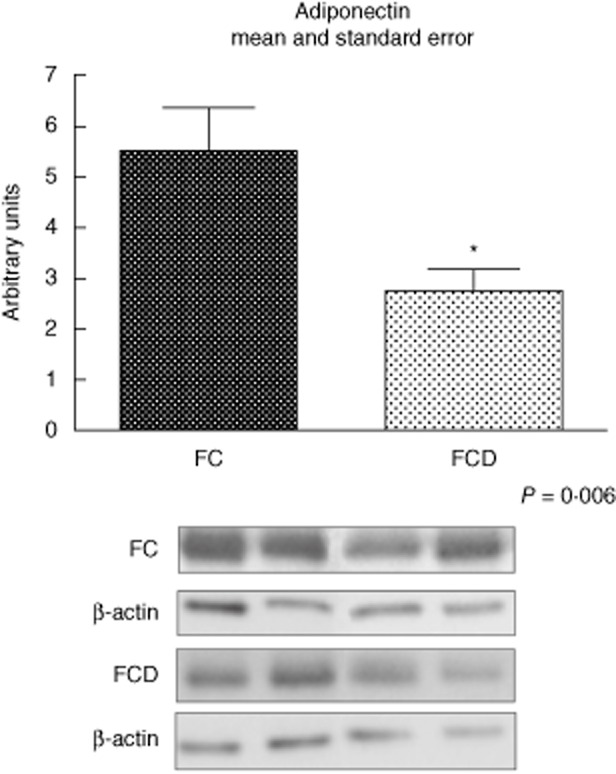
Fig. 5.

Representative Western blot analyses and determination of adiponectin protein expression in fat tissue of the control (FC) and Crohn's disease (FCD) groups. For illustration purpose each band represents one patient. For FCD group, n = 10; for FC group, n = 8, *P < 0·05 versus control.
