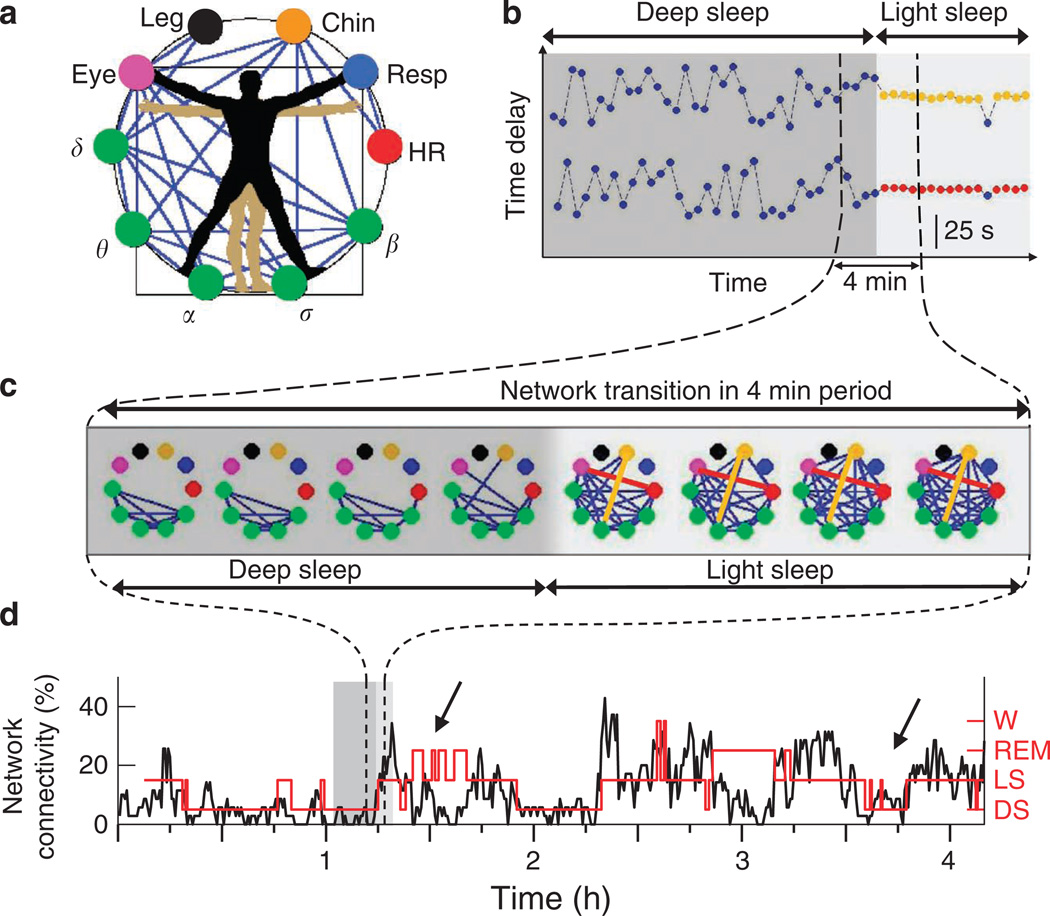
Figure 1. Transitions in the network of physiological interactions.
(a) Dynamical network of interactions between physiological systems where ten network nodes represent six physiological systems—brain activity (EEG waves: δ, θ, α, σ and β), cardiac (HR), respiratory (Resp), chin muscle tone, leg and eye movements. (b) Transition in the interactions between physiological systems across sleep stages. The time delay between two pairs of signals, (top) α-brain waves and chin muscle tone, and (bottom) HR and eye movement, quantifies their physiological interaction: highly irregular behaviour (blue dots) during deep sleep is followed by a period of TDS during light sleep indicating a stable physiological interaction (red dots for the HR–eye and orange dots for the α–chin interaction). (c) Transitions between physiological states are associated with changes in network topology: snapshots over 30-s windows during a transition from deep sleep (dark grey) to light sleep (light grey). During deep sleep, the network consists mainly of brain–brain links. With transition to light sleep, links between other physiological systems (network nodes) emerge and the network becomes highly connected. The stable α–chin and HR–eye interactions during light sleep in (b) are shown by an orange and a red network link, respectively. (d) Physiological network connectivity for one subject during night sleep calculated in 30-s windows as the fraction (%) of present links out of all possible links (brain–brain links not included, see Fig. 3e). Red line marks sleep stages as scored in a sleep lab. Low connectivity is consistently observed during deep sleep (0:30–1:15 h and 1:50–2:20 h) and REM sleep (1:30–1:45 h and 2:50–3:10 h), while transitions to light sleep and wake are associated with a significant increase in connectivity.

