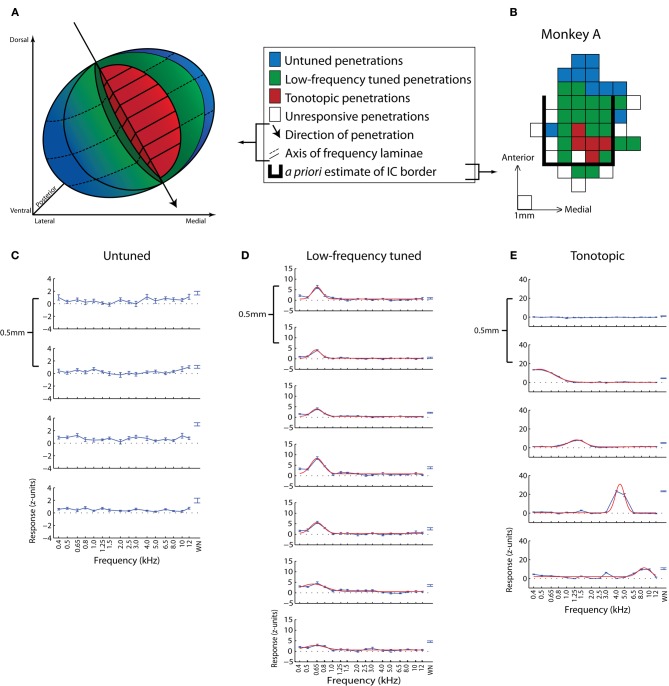
Figure 2.
Map of sound frequency representation in the monkey IC. (A,B) Three-dimensional schematic of sound frequency representation (A) based on a representative example dataset (B) from Bulkin and Groh (2011). Untuned sites are presumed to be in the outer sIC, low-frequency tuned sites from near the sIC-ICC border, and tonotopic sites from the center of the ICC. The grid in (B) is a top-down view of the recording grid for one monkey in the study. Each square represents a penetration site and is colored based on the response properties of that site. The bold black line delineates the a priori estimated boundaries of the IC based on MRI scans. (C–E) Example penetrations from untuned (C), low-frequency tuned but not tonotopic (D), and tonotopic (E) penetration locations. Each series is comprised of multiple recordings taken from a single example penetration. Frequency response functions were recorded at 0.5 mm increments along the dorsolateral-ventromedial penetration axis. The first graph in each series corresponds to the first, i.e., most dorsal, site to show responses to auditory stimuli along that penetration. Absolute depths of first responsive sites varied across penetrations. Blue lines (C–E) indicate the normalized average response over a 200 ms period as a function of sound frequency, and red lines (D,E) show the best Gaussian curve fit to tonal data. (B–E) Adapted from Bulkin and Groh (2011).

