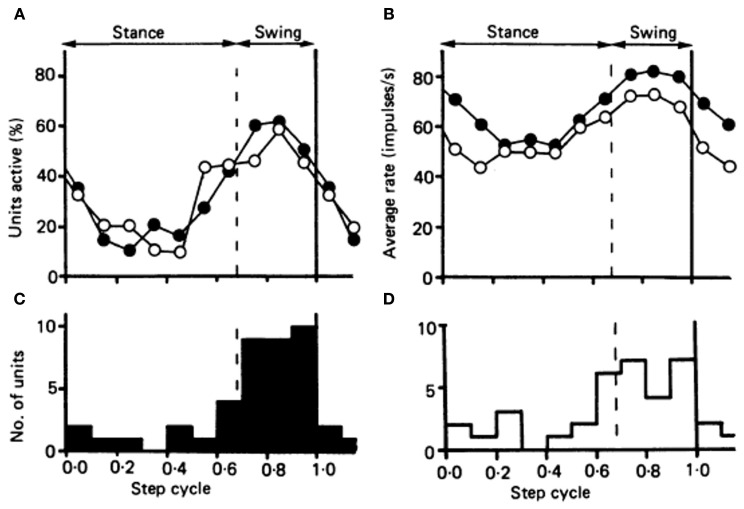
Figure 2.
Comparison of the timing of the activity in the population of 34 Purkinje cells in the cat identified as belonging to cl zone, with the timing of the activity in a population of forelimb-related neurons of nucleus interpositus. (A) Plots showing the proportion of neurons in each population “active” during each tenth of the step cycle. Open circles, cl Purkinje cell population; filled circles, the population of interpositus neurons. (B) The fluctuation in discharge rate amongst the two populations during the course of the step cycle. Open circles represent the Purkinje cells of the cl zone; and filled circles the interpositus neurons. (C and D) Histograms showing the number of neurons attaining their peak discharge rate during each tenth of the step cycle, for the interpositus neurons and the Purkinje cells of the cl zone respectively. Reprinted from Armstrong and Edgley (1984b), with permission.

