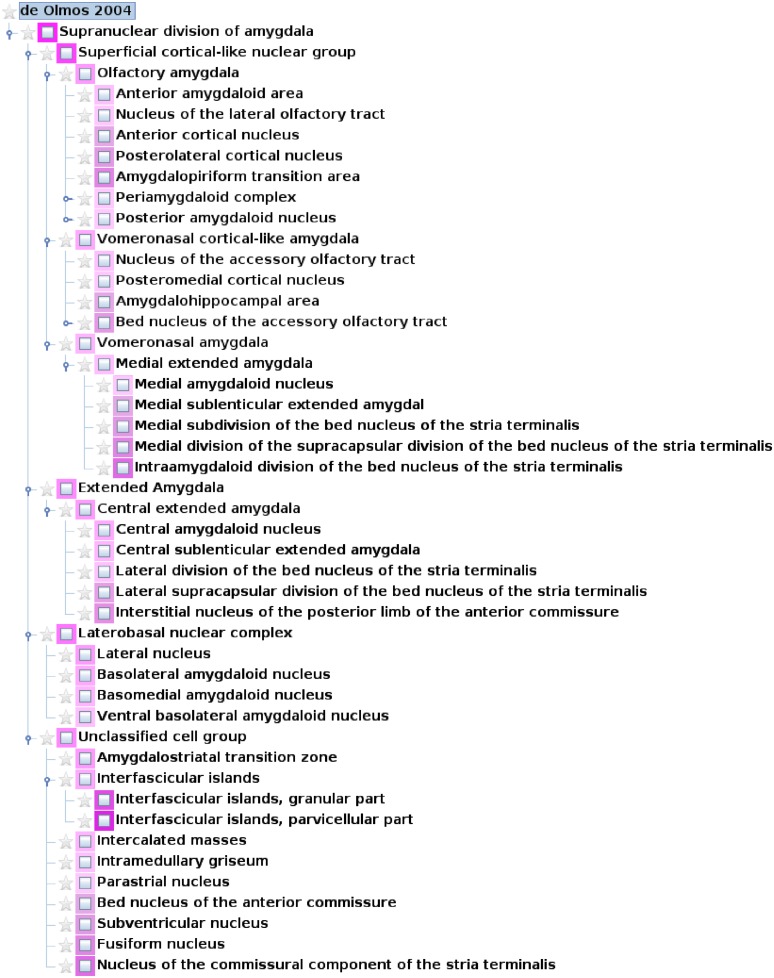
Figure 2.
A hierarchical nomenclature of subregions of the rat amygdala based on (de Olmos et al., 2004) has been implemented for the rat connectome project in neuroVIISAS. Only the top levels of the hierarchy are shown. Different intensities of magenta indicate different subregions.

