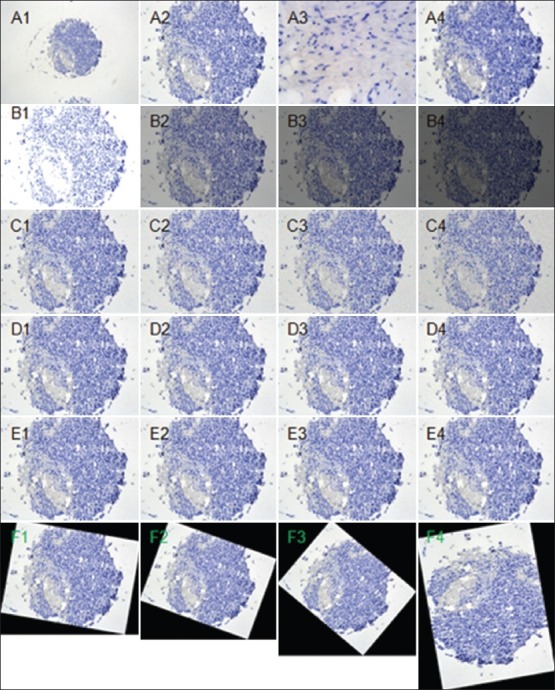
Figure 2.

One representative normal breast TMA core taken at different magnification objectives 10× (A1), 20× (A2), and 40× (A3). A4 represents out of focus under 20x. B1 to B4 represent different levels of illumination; C1 to C4 denote different levels of speckle noise with zero mean and variance at 0.02, 0.04, 0.08 and 0.16, respectively; D1 to D4 represent different levels of compression; E1 to E4 denote different levels of B-spline distortion; F1 to F4 show the transformed images under different rotation angles at 10, 20, 40 and 80 degrees using the center of the image as the origin
