
Figure 2.
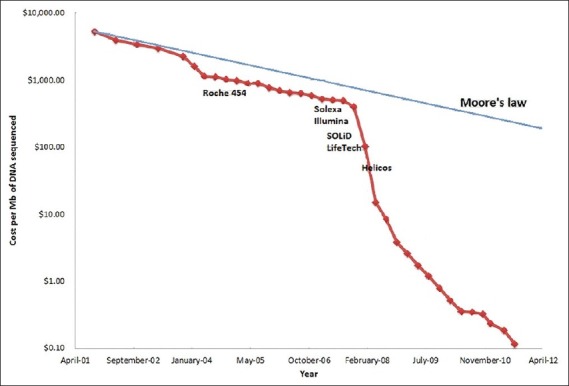
Cost per megabase of DNA sequenced in the last decade. The semi-log plot shows a dramatic reduction in the cost per megabase of DNA sequenced in the last decade. Also shown are the approximate dates of introduction of different NGS instruments by commercial vendors into the market. The costs have fallen dramatically since 2007 due to competition from multiple vendors. Data source – http://www.genome.gov/sequencingcosts/