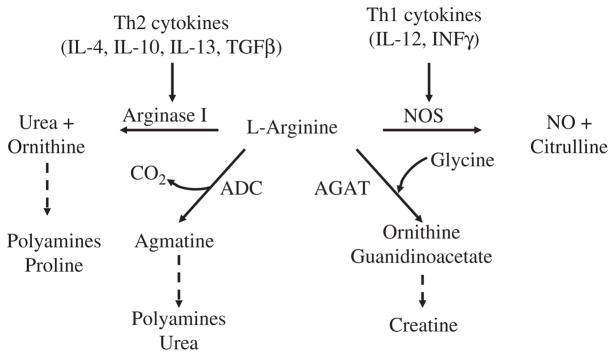
Figure 1. L-Arg metabolism.
For the sake of simplicity, emphasis is on enzymes that directly metabolize L-Arg. This diagram should not be interpreted to indicate that all of these enzymes are expressed simultaneously in any given cell type. Th2 cytokines lead to the increase expression of arginase I, while Th1 cytokines increase inducible NOS. ADC, Arginine decarboxylase; AGAT, arginine: glycine amidinotransferase; NO, nitric oxide; NOS, nitric oxide synthase.

