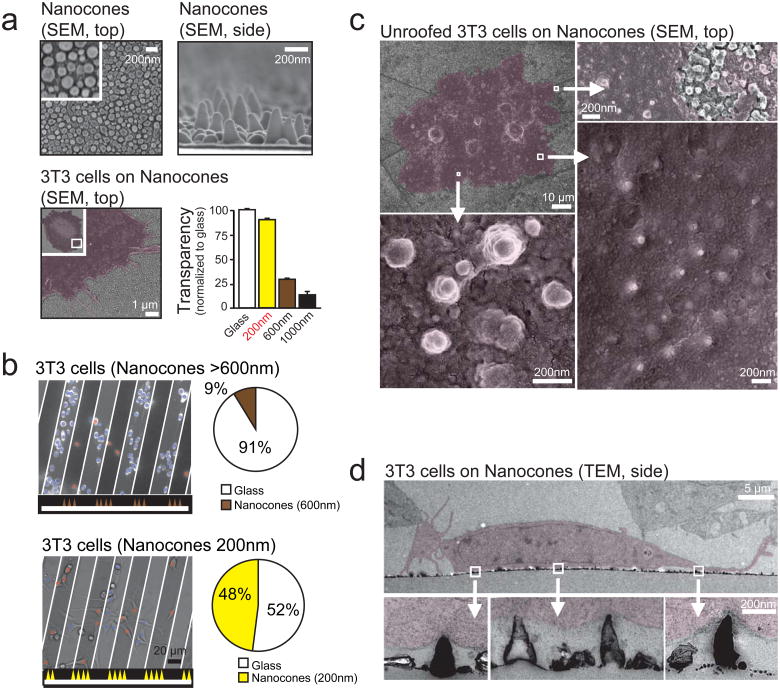
Figure 1. Nanocones induce inward curved PM deformations at the basal PM of adherent cells.
(a) Scanning electron micrographs of Nanocones on glass substrate shown from the top (top, left) and the side (top, right). SEM of 3T3 cells (red) grown on 200nm Nanocones (bottom, left). Transparency of Nanocones decreases with increasing cone height (bottom, right). For each height, transparency was measured at 8 different regions of the sample. Error bars represent s.e.m. of the mean value. (b) 3T3 cells cultured on 20μm wide stripes of 600nm Nanocones (top) and 200nm Nanocones (bottom). The sawtooth symbols at the bottom of the panels and the white lines depict the location of the Nanocone stripes. After 48h cell density on 600nm cones (brown) is significantly lower compared to adjacent glass surface while no changes are visible for 200nm Nanocones (yellow). Analysis of cell density for Nanocones of 600nm (n=1484 cells, top) and 200mn (n=780 cells, bottom) height are shown to the right. (c) Scanning electron micrographs of the inner side of the PM of cells grown on 200nm Nanocones. Cells were sonicated to remove all but the PM of cells grown on Nanocones (red). Note the Nanocone-induced deformation of the PM (d) Transmitted electron micrographs of 3T3 cells grown on 200nm Nanocones. Cells are colored in red. Note that Nanocones do not penetrate the PM. Scale bars; (a), top panels 200nm, bottom panel 1μm; (b), 20 μm; (c), top left panel 10 μm, all other 200nm; (d), top panel 5 μm, bottom panels 200nm.

