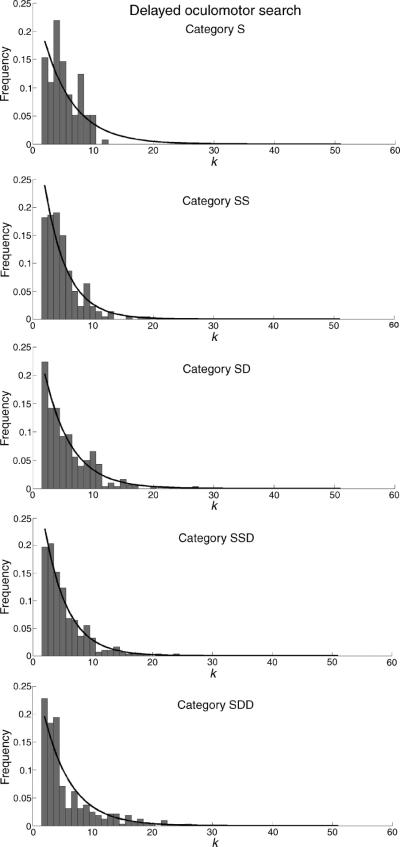
Figure 11.
Histograms showing the distributions of k, the number of locations visited between visiting and revisiting a location, under delayed oculomotor search, Experiment 2. Equation 2 is plotted with the best-fit parameters of M and ε for each category (see text for details).

