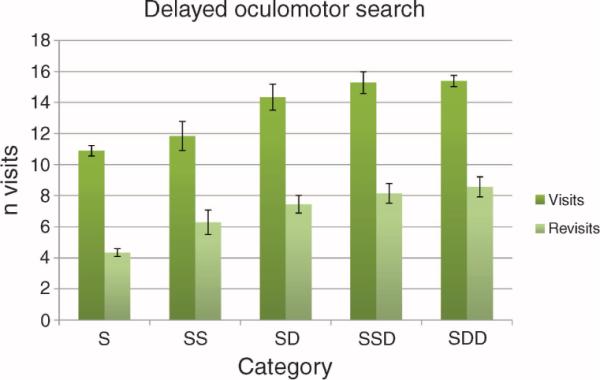
Figure 8.

Mean visits and revisits to objects in the display during delayed oculomotor search (Experiment 2). Each bar represents performance averaged over the 7 subjects (subjects were tested in 4 to 5 trials per category rule). Trials on which an error was made were not included. Error bars represent ±1 standard error.
