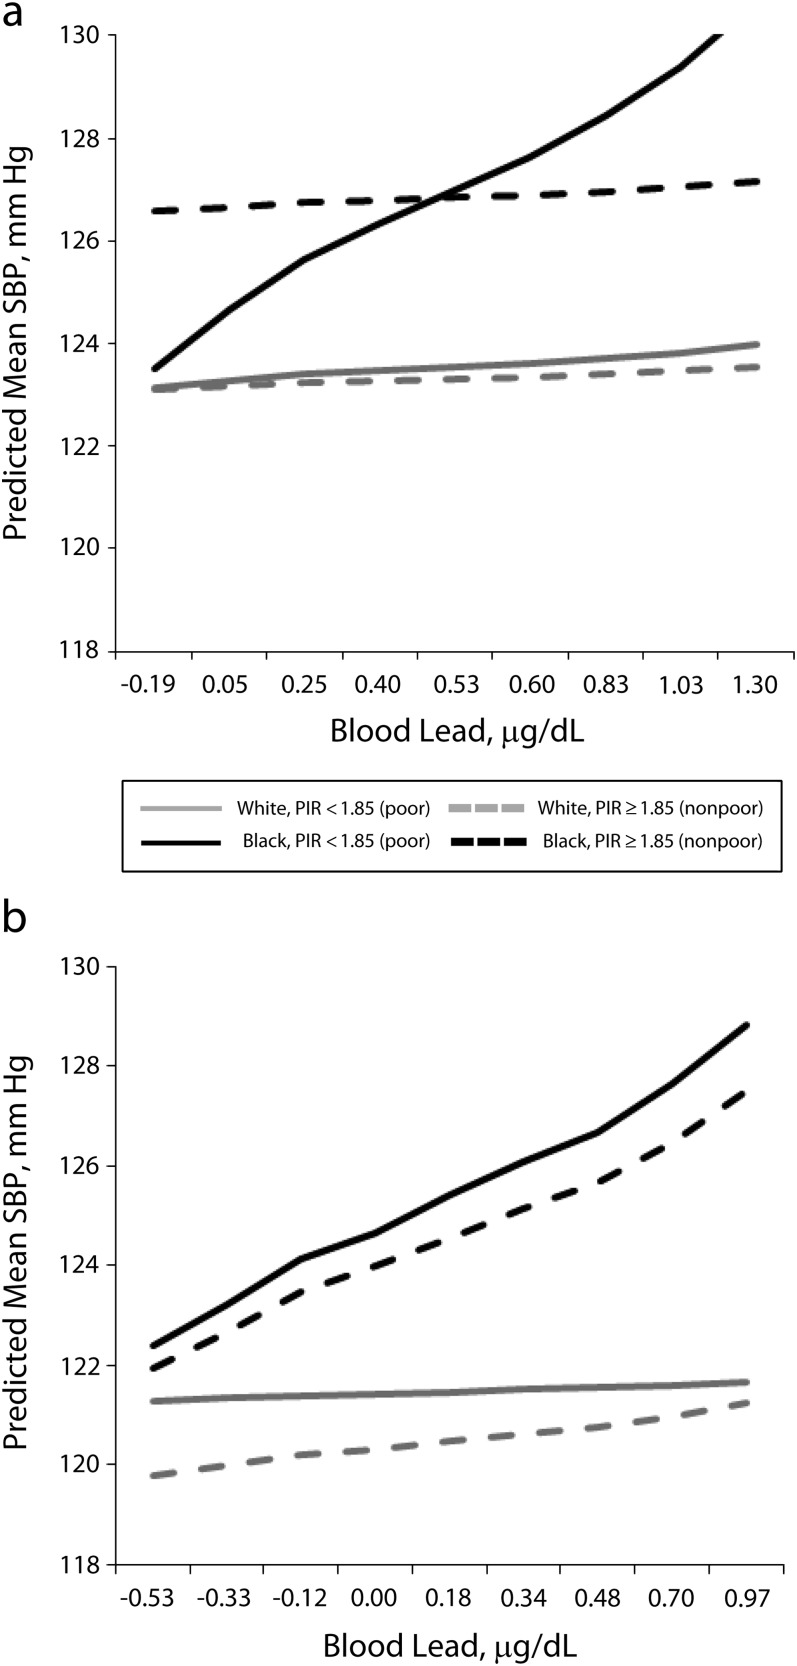
FIGURE 2—
Association between blood lead and systolic blood pressure by race-poverty group, stratified by gender: National Health and Nutrition Examination Survey, United States, 2001–2008.
Note. PIR = poverty income ratio; SBP = systolic blood pressure. All results were weighted to account for complex survey design. Regression models controlled for age, age2, hematocrit, body mass index, heavy alcohol use, smoking status (never, former, current), diabetes diagnosis, education (< high school, high school, > high school), and antihypertensive medication use, and dietary intake of sodium, calcium, and potassium. Log-transformed blood lead level, on the x-axis, is that for each decile of the gender-specific distribution. The PIR is the ratio of the family’s gross income to the family’s poverty threshold as determined annually by the US Census Bureau.

