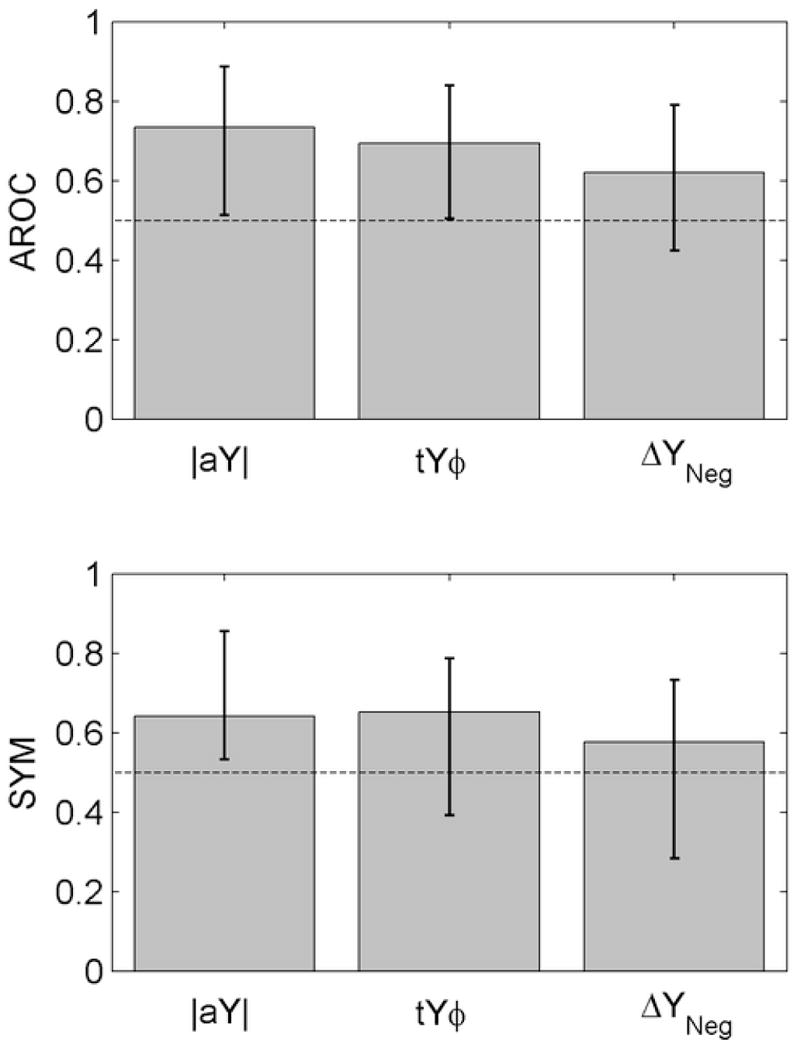
Fig. 10.

Day-2 test performance results for selected WB and 1-kHz predictors. Height of bars show AROC and SYM values (top and bottom panels, respectively). Error bars represent 95% CIs. The horizontal, dashed line represents an AROC or SYM of 50%, or chance performance.
