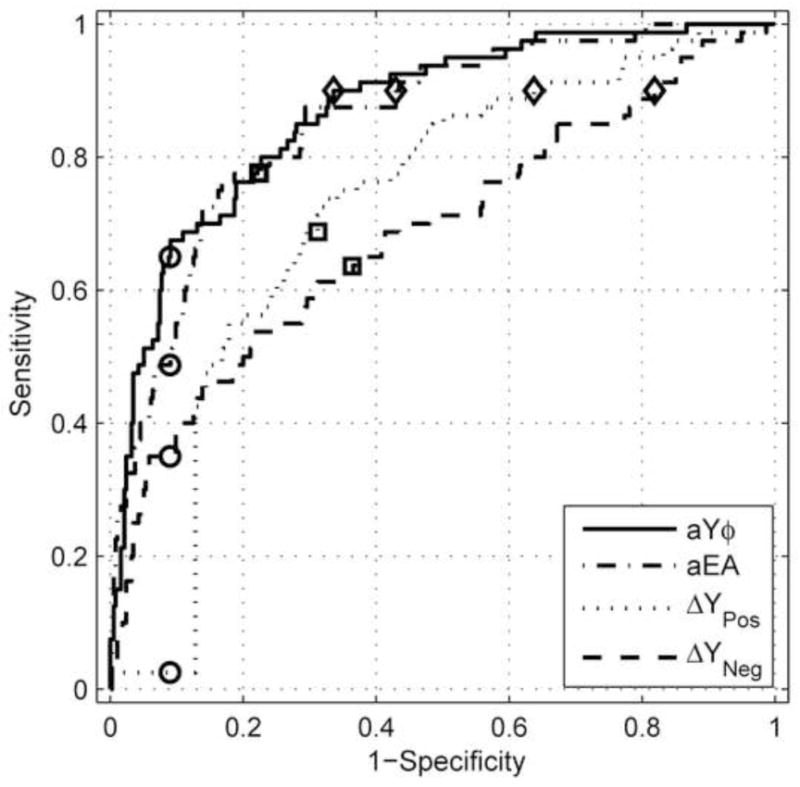
Fig. 11.

ROC curves plotted for two 1-kHz (ΔYPos, ΔYNeg) and two WB (aYϕ, aEA) predictors. Squares represent points on an ROC curve at which the sensitivity and specificity are most nearly equal, referred to as the point of symmetry (SYM). Circles represent sensitivities at a fixed specificity of 91%. Diamonds represent specificities at a fixed sensitivity of 90%.
