Fig. 7.

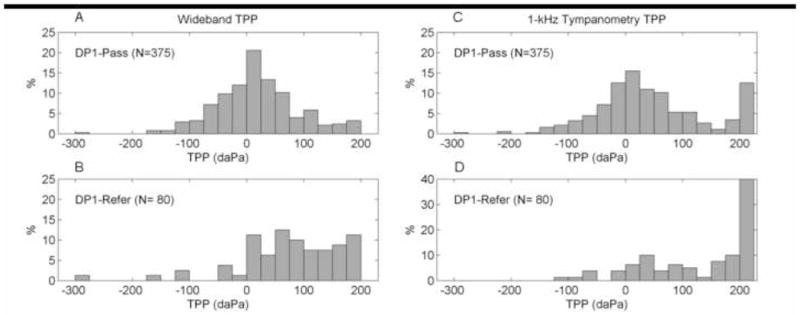
Distributions of WB (panels A and B) and 1 kHz (panels C and D) TPP for DP1-Pass and DP1-Refer groups. The vertical bars represent the proportion of subjects with a given TPP as a function of TPP intervals (width of 25 daPa).

Distributions of WB (panels A and B) and 1 kHz (panels C and D) TPP for DP1-Pass and DP1-Refer groups. The vertical bars represent the proportion of subjects with a given TPP as a function of TPP intervals (width of 25 daPa).