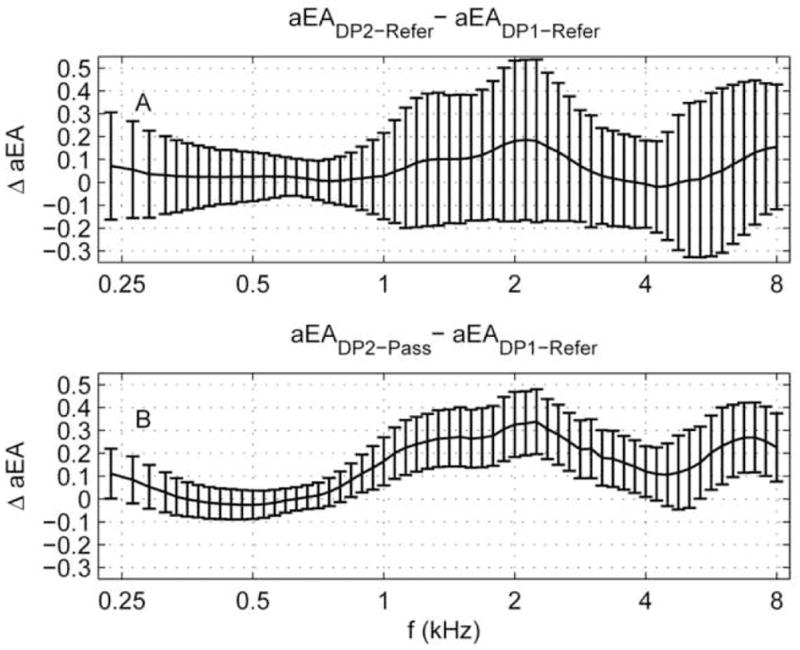
Fig. 9.

Panel A: Mean ΔaEA for the DP2-Refer group (N=14 ears) relative to DP1-Refer group (N=80 ears), (i.e., it is the aEA shift in the refer groups on Day 2 relative to Day 1). Panel B: Mean ΔaEA for the DP2-Pass group (N=53 ears) relative to DP1-Refer group (N=80 ears). Error bars represent the 95% CI as calculated using a two-sided t-test for independent samples not assuming equal population variances.
