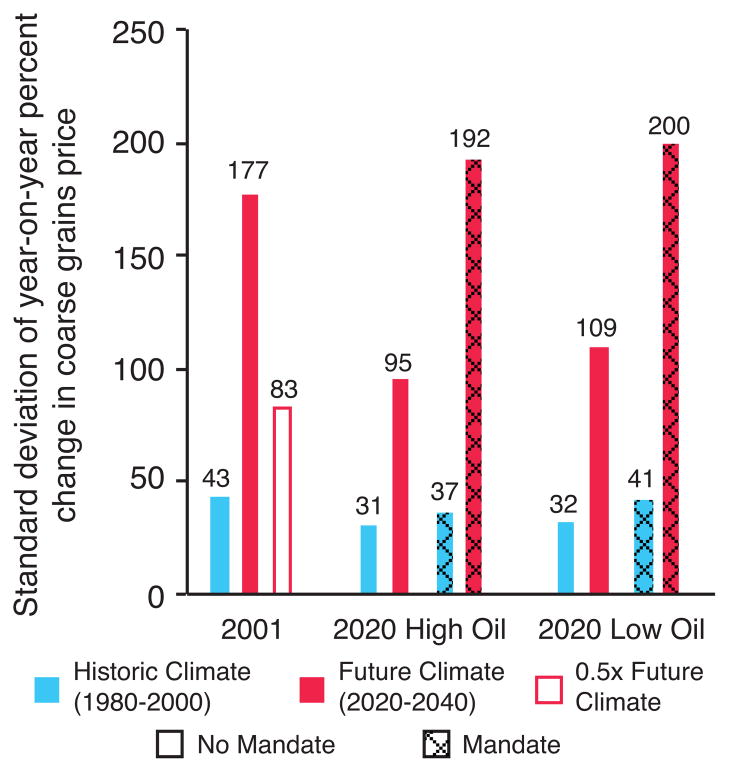
Figure 1. Standard deviation of year-on-year percent change in US corn prices under alternative climate, policy and economic scenarios.
Each bar shows the standard deviation of US corn prices in the historic (blue) and future (red) climate, in the presence (hashed) or absence (unhashed) of the biofuels mandate and high ($169/bbl) or low ($53/bbl) oil price (see Methods and SI for details). The number above each vertical bar reports the value of year-on-year price volatility in that model prescription. The white bar shows price volatility for half of the future change in yield volatility. (See SI for additional sensitivity analysis.)

