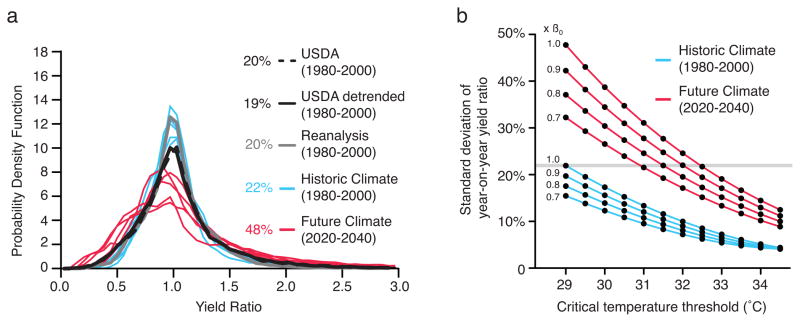
Figure 2. US corn yield ratios in the historic and future climate.
(a) Observed and simulated distributions of yield ratios (yt/yt−1). The colored numbers show the standard deviation of year-on-year yield ratios, including the mean of the standard deviations from the five realizations. The confidence intervals for α and β reported by Schlenker and Roberts give volatility ranges of 20–24% and 43–53% for the simulated historic and future climates, respectively. (b) Curves show the response of US corn yield ratio volatility to changes in the critical temperature threshold for different fractions (x β) of the Schlenker-Roberts β value denoting the associated yield penalty.

