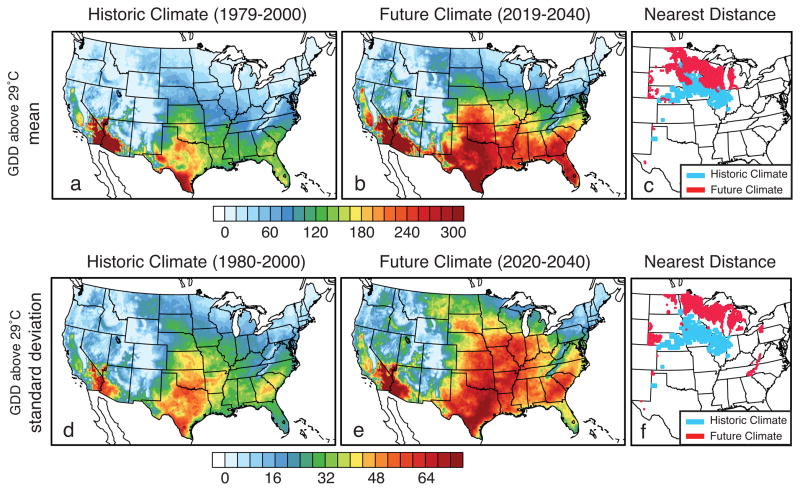
Figure 3. Nearest distance to equivalent temperature envelope in the future climate.
Color contours show GDD above 29°C in the historic (left panels) and future (center panels) climate. The blue area in the right panels shows the county weights in US corn production exceeding 0.18% in the 1979–2000 period; the red area shows the grid points in the future climate that exhibit the minimum grid-point distance to a GDD value within 1 GDD of each of the blue grid points. Each gridpoint is allowed to be occupied only once in the future climate (see SI for details).

