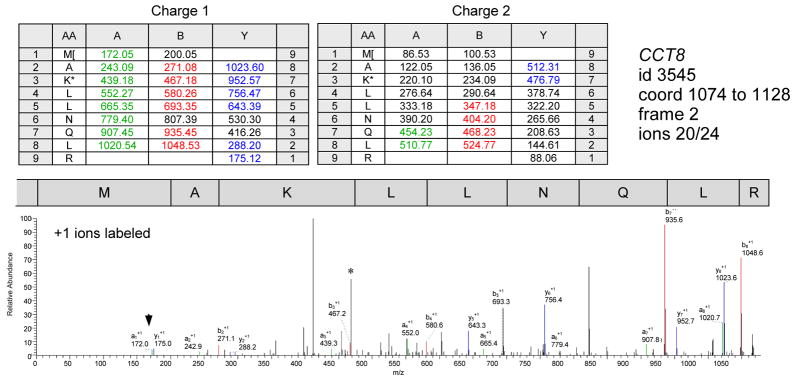
Figure 2. MS/MS spectrum of CCT8 downPeptide.
MS/MS spectrum of glutaraldehyde modified downPeptide fragment MAKLLNQLR from gene CCT8 (id3545); the dnAUG maps 24 codons downstream of the annAUG. The methionine and lysine are both modified by glutaraldehydation (+68 Da). This spectrum has matches to many of the possible CID fragments (19 resolable 1+ ions out of 24; in addition, the b6 fragment was detected among the +2 charged ions *). Matched +1 ion peaks are labeled with designations (a, b and y ions labeled with green, red and blue respectively); the a1 ion (arrowhead) is sometimes enhanced with glutaraldehyde treatment (16).

